Key Points / ROC
-
ROC means Rate of Change
-
ROC is the simplest momentum indicator
-
ROC is best used for confirmations or warnings
-
Tools for ROC: #cryptowatch #bitfinex
ROC, or Rate of Change, is a technical indicator that helps you to be on the lookout for a new trend in the market.
The Rate of Change indicator is a pure momentum indicator. It measures the velocity of price change. That is the percentage change in price from period to period, so you can identify potential trend shifts before they happen.
The difference between how fast price is moving vs how much it is moving is crucial when you want to analyse momentum: If the price of Ethereum sits at 1000 USD and increases by 50 USD every day, then the rate of change will be showing a slowdown. An increase from 1050 USD to 1100 USD is a lower percentage increase than the jump from 1000 USD to 1050 USD.
The Rate of Change formula is as follows:
ROC = 100 * (New price - Old price)/(Old price)
What a simple indicator, but helps so much with your charting.
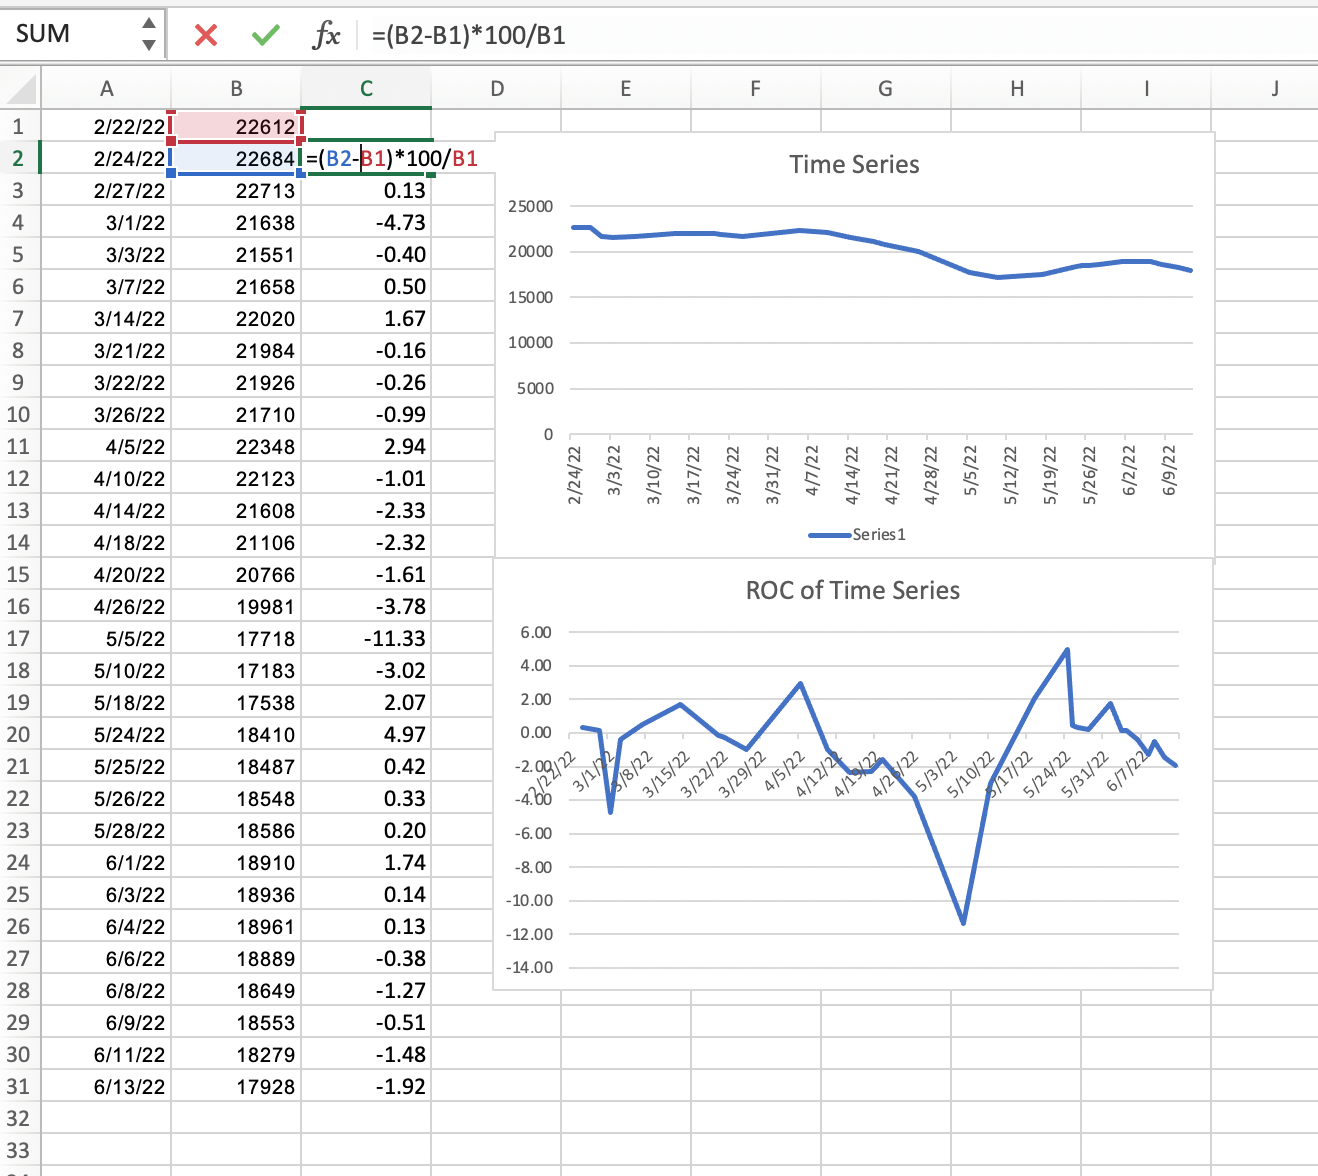
ROC formula in Excel: exaggerates every show of weakness or strength
The simplicity of ROC also makes it super easy to use in Excel or Spreadsheets, using it to help you interpret any sort of time series data. Here’s the ROC of a time series of non-finance data.
Notice that at a time when the time series still looked like it’s “holding up quite well”, the ROC was already painting a very different picture.
ROC exaggerates every show of weakness or strength.
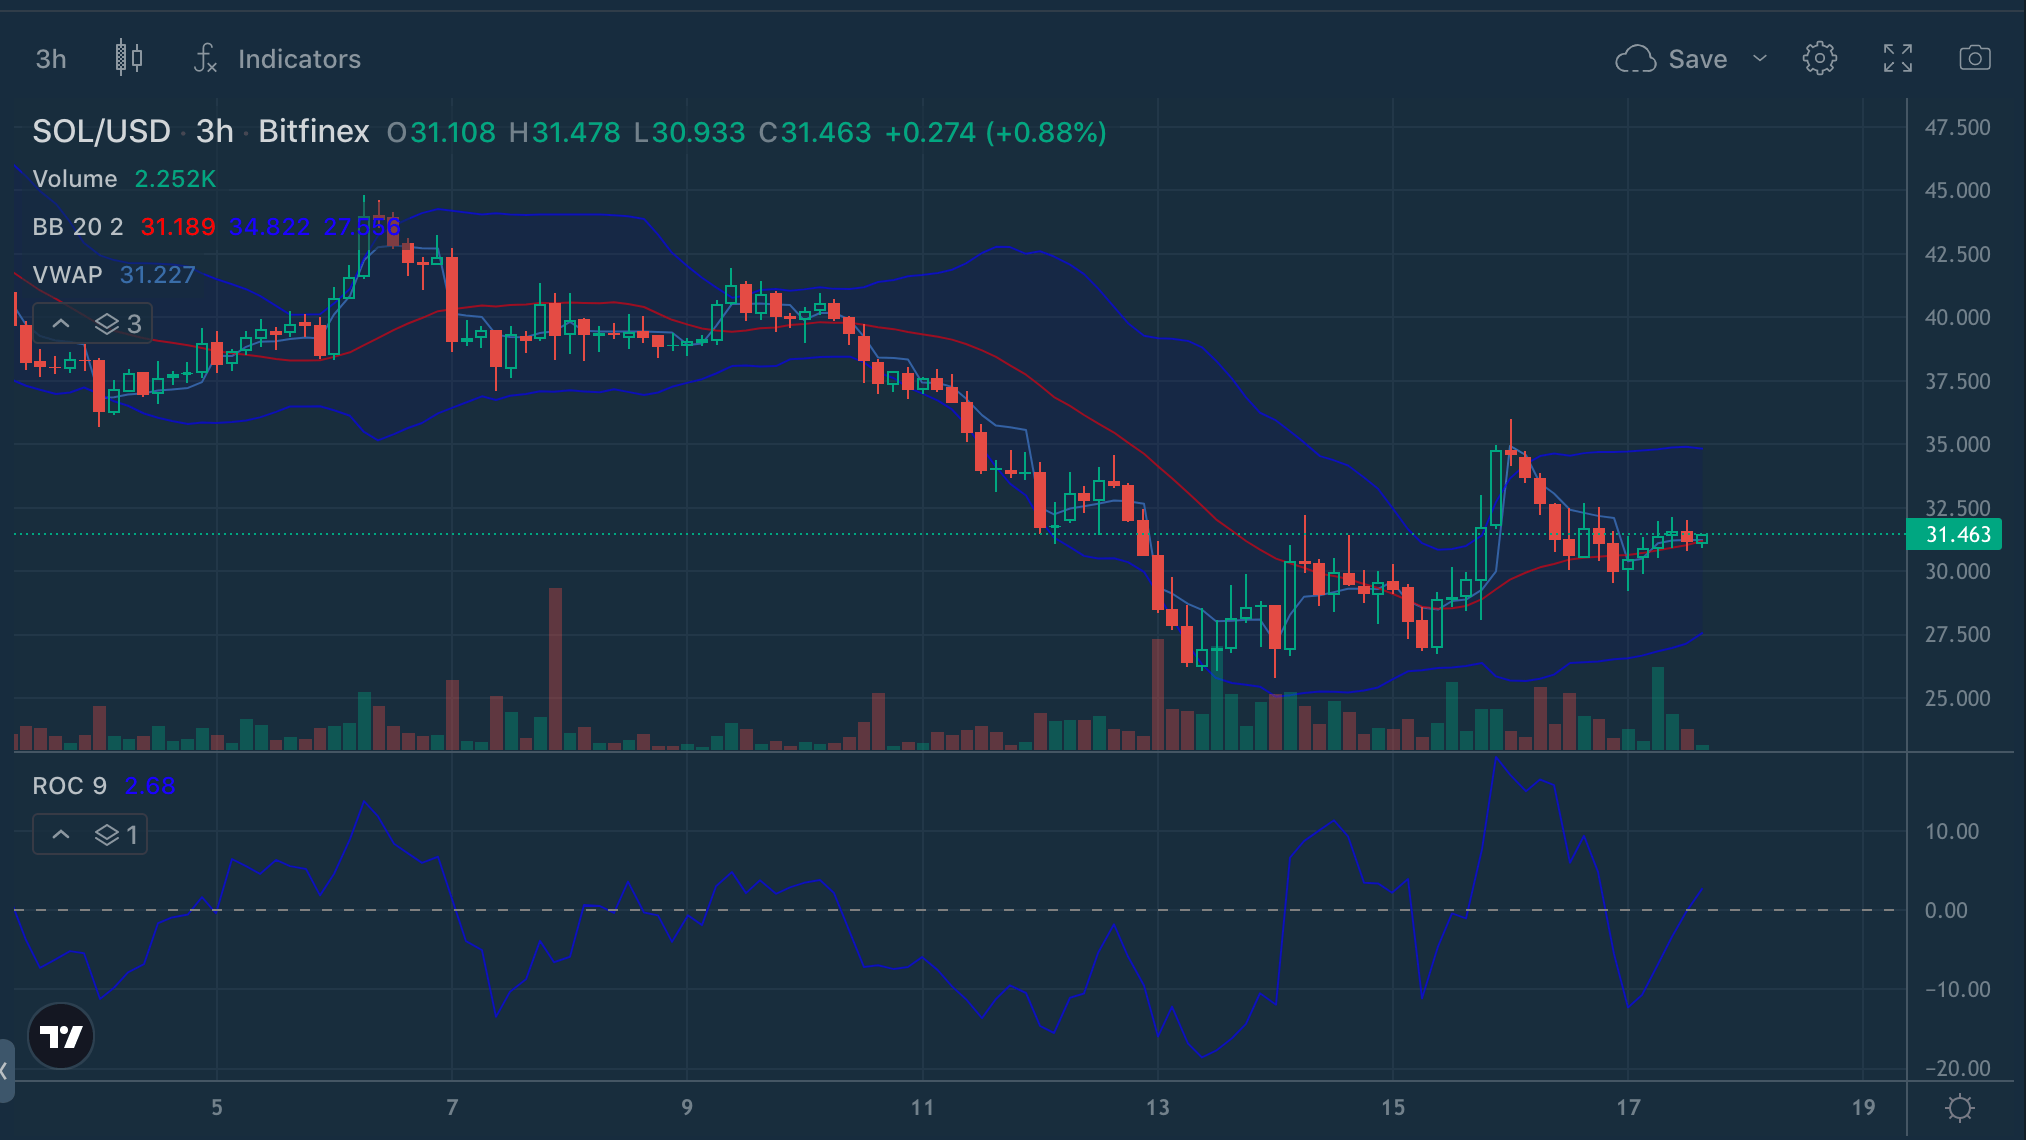
ROC is available on Bitfinex and FTX
ROC is really dead simple and it’s available in the basic set of TA tools on popular custodial exchanges. Of course you can get ROC in TradingView library as well.

ROC in the indicator pack on FTX.com
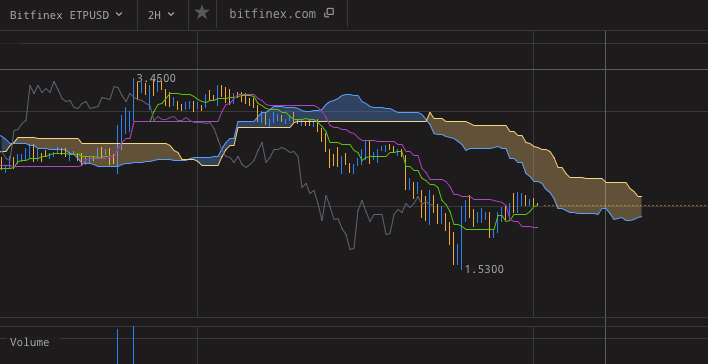
ROC on Bitfinex
How to trade with ROC
The ROC is a momentum oscillator that can be used to identify changes in the market trend. It is best used to verify buy and sell signals, not as a standalone strategy.
- Crossover ROC oscillates between negative and positive values. One simple signal that traders read is the crossover of ROC over 0, which is the middle line. This, on long enough timeframes, can be an early signal of reversal.
- S/R: In some markets, ROC can keep its own support and resistance levels. It depends on the market though - less volatile, mature markets have more of this tendency. In crypto, it only makes sense to consider doing this in the biggest markets.
- Divergence ROC can be used to check for divergences instead of MACD or RSI. This makes it a popular tool among traders who are not fond of the RSI family of indicators.
Bearish ROC divergence
When a cryptocurrency rallies to a new high but the ROC indicator makes a lower high, that is a warning the trend might soon reverse because the price and momentum are not matching. That’s a bearish divergence: Underlying weakness in an uptrend.
Bullish ROC divergences
When the price action drills down, approaching or making new lows, but the ROC is grinding up, that points to an underlying strength in the market.
Using ROC with other indicators
So, ROC is not a good indicator to be used on its own - much like divergences aren’t.
Because it is a momentum oscillator, the best complements to it would be volume profiles or any other volume indicators like OBV.
Charting support and resistance price-wise makes a lot of sense too. Even better is charting such levels in terms of Bollinger Bands - as a distance from a standard deviation.
Bottom line
With ROC, you can trade verify your momentum analysis confidence knowing that you have all the information you need right at your fingertips. It’s a fairly simple indicator, you won’t misinterpret it even if you wanted to. It’s also widely available, including in the basic version of TradingView charts on Bitfinex.
More on ROC