What are divergences in trading?
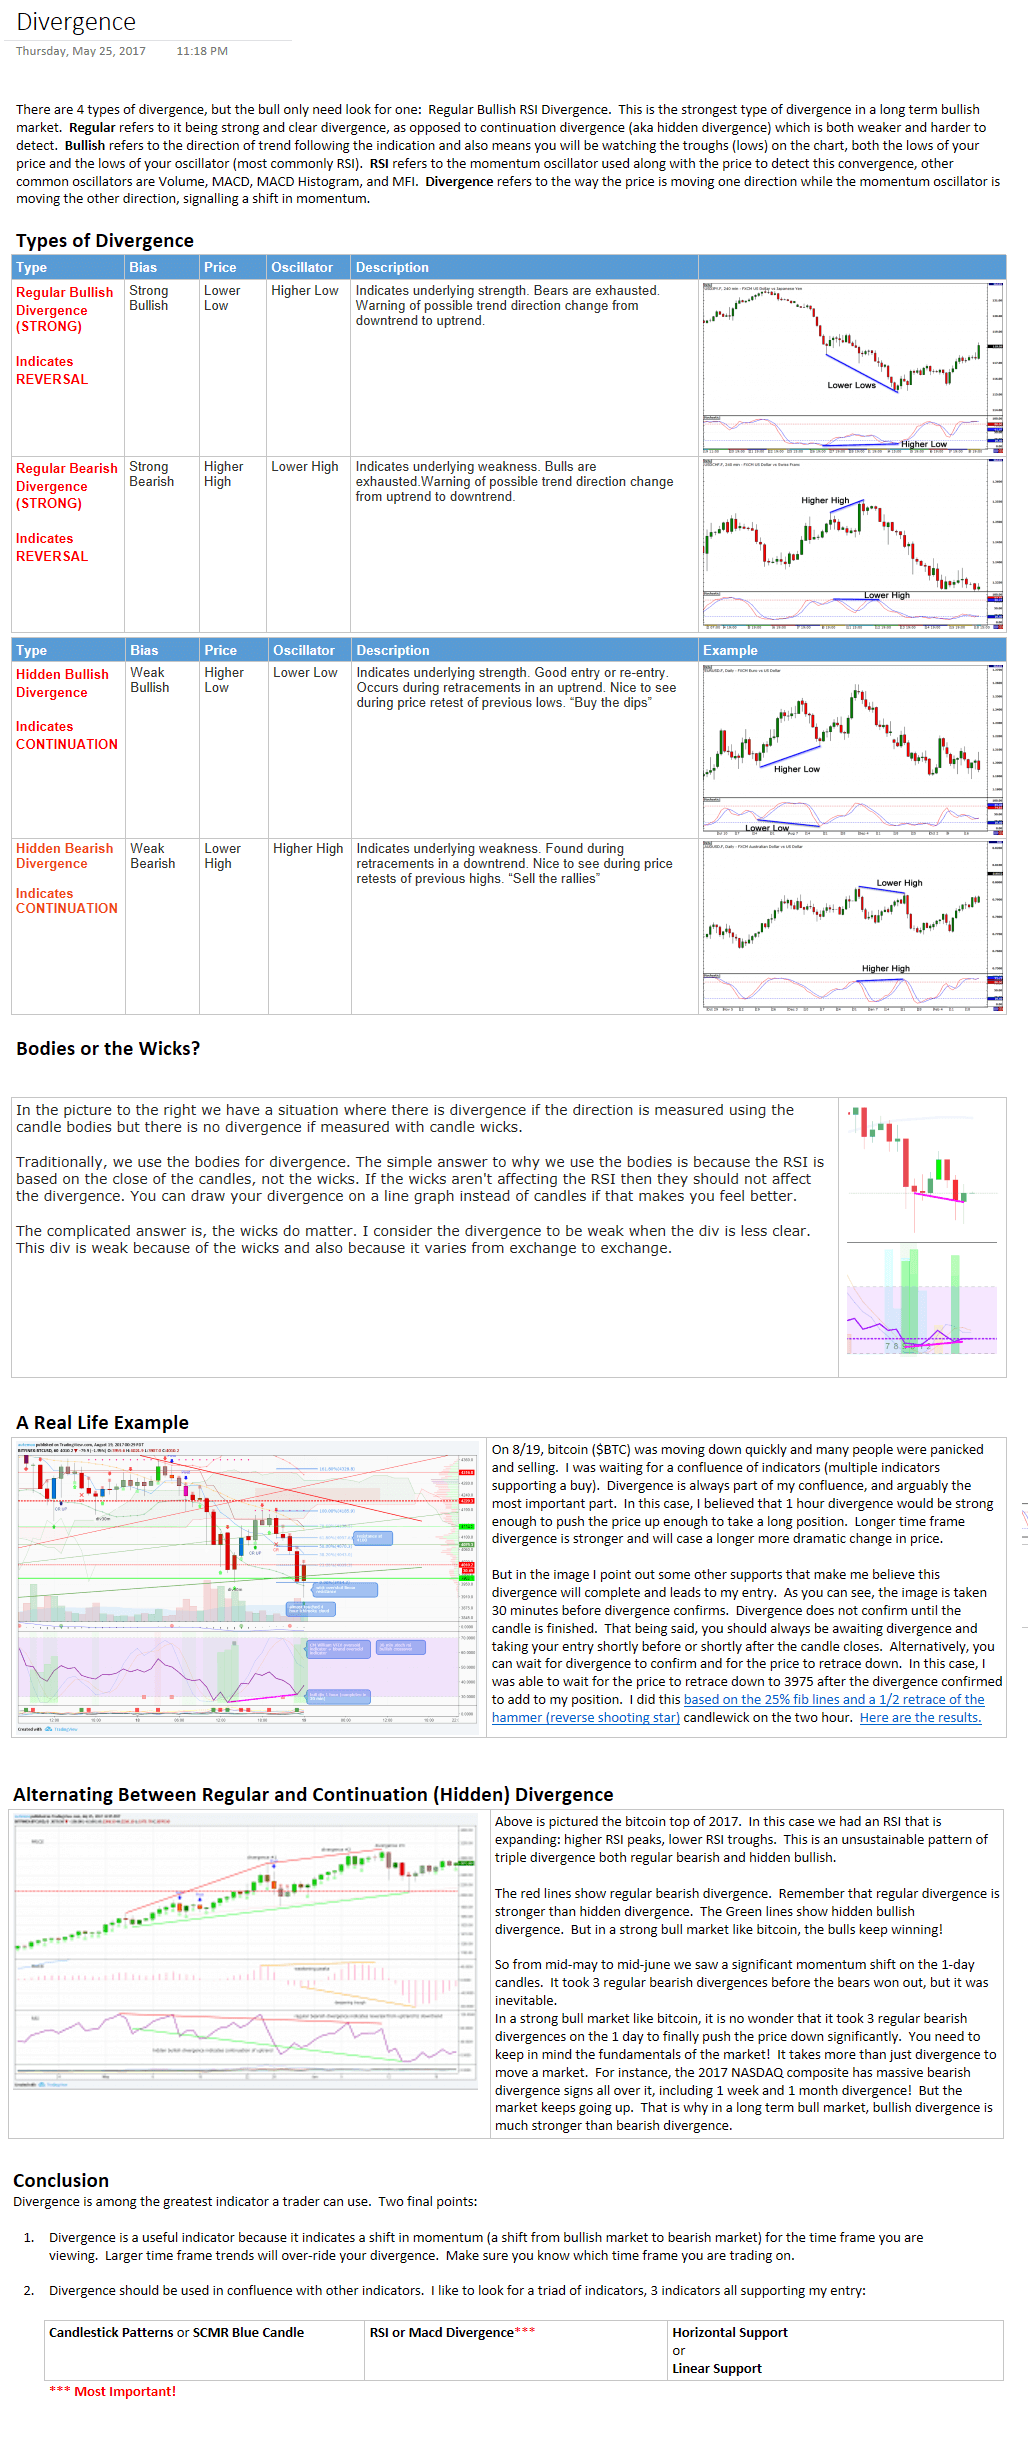
When traders talk about divergences, or divs, they are pointing out a disagreement between the price action and an oscillating technical indicator.
The indicator of choice is typically MACD, OBV, RSI, stochRSI or similar.
Divergences point to a momentum in the market. Depending on the type of the divergence they suggest either continuation or reversal.
How to find a divergence on a chart
- Open the crypto market that interests you in a charting app like TradingView (free tier is fine).
- Load in an oscillator (in TradingView, the “f” icon in top left). Most crypto traders look for RSI divergences on the StochRSI indicator.
- The thing to look for in the price action are highs and lows. Pick a pair of prominent highs if the market is trending up. Pick a pair of prominent lows if the market is trending down.
- Look at the indicator in the same area (just below your pair of highs or lows). Check if your indicator printed a mirror image: If the price made higher high, look for lower high in the indicator.
Divergence Cheat Sheet
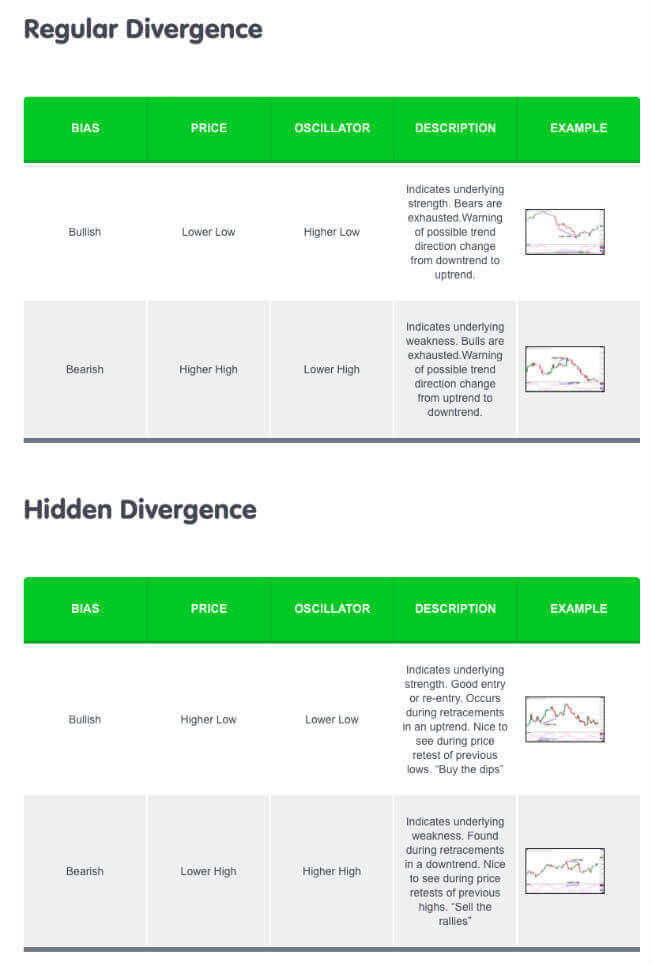
- Comprehensive Divergences Cheat-sheet with proper explanations. It is valid for all oscillating indicators, you can use it to evaluate MACD divergences as well as RSI divergences.

How to interpret divergences
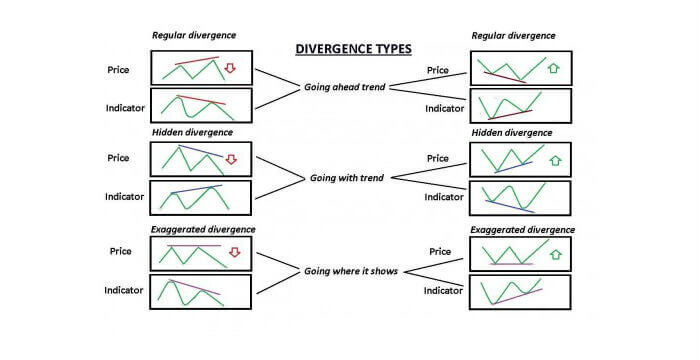
We distinguish regular divergence, hidden divergence and exaggerated divergence.
Regular divergence
Regular Divergence is a sign of trend reversal: Price keeps the trend but oscillator is already showing the momentum is weakening.
-
Bearish Regular Divergence
Bearish Regular Divergence is a signal to short.
Price makes higher high but oscillator makes lower high. This shows the onset of market weakness, possible exhaustion at the end of a bull trend.
Look for bearish regular divergence in tops.
-
Bullish Regular Divergence
Bullish Regular Divergence is a signal to long.
Price makes lower low but oscillator makes higher low. Underlying strength, possible bottoming in progress.
Look for bullish regular divergence in bottoms.
Hidden divergence
Hidden Divergence is a divergence that follows the trend on longer time frames (1D, 1W). Hidden divs show the market is inclined to continue the current overarching trend and that the current short-term action is just a retracement, but likely not a reversal.
-
Bearish hidden divergence
Bearish hidden divergence is a signal to short.
Price makes lower highs but oscillator makes higher highs. Tends to be found in bounces within a downtrend.
Look for hidden divergence in local tops within a downtrend.
-
Bullish hidden divergence
Bullish hidden divergence is a signal to long.
Price makes higher low but oscillator makes lower low. Tends to be found during continuation pauses in an uptrend.
Look for bullish hidden divergence in bottoms on retracements.
Exaggerated divergence
Exaggerated Divergence is different only in that price makes double top or double bottom rather than a single new high or a single new low.
How to trade on divergences in crypto
Divergences only show a level where to wait for your entry signal.
The logic behind divergences is that sometimes oscillating indicators show nascent tendencies of the market (strength or weakness) that might not be visible from the price action yet.
However, this is not a sharp enough indication to signal the actual entry.
It gives the idea about the direction you should be looking for when looking for an entry on that timeframe but you will need to dig deeper and switch to shorter timeframes to find a good entry.
Trading only on divergences increases your risk unnecessarily, divergences are too vague.
Here’s more on Crypto Divergences by Josh Olszewicz
Which oscillator to use for divergences
-
OBV divergence Volume vs Price
We wrote a ScriptSpotlight on OBV vs price divergences here.
-
Price vs MACD Divergence, standard settings
This is a regular bullish divergence on an old ETHUSD chart.
-
Price vs StochRSI Divergence
This is a 1D chart of BTCUSD, Bitfinex. The StochRSI shows hidden bearish divergence, the momentum is set to continue the bearish trend.
-
Price vs %b Divergence, BBands 21 periods - stdev 3
Divergence with %b is a more precise way to observe whether new extremes of the price action are closer to or farther from the bollinger band’s boundaries. There is a more reliable version of the double bottom formation on the bbands: price makes a new low but that now is not a new low relatively to the bbands. That is to say, the first low is below the lower bband and the second low is a lower low in absolute terms (the price) but also either on or above the lower bband - video on bbands explaining that in this article.
TradingView provides the %b indicator which measures how far is the price from the bollinger band of your selected standard deviation and it plots this distance. The situation where you have new low in price but not a new low relatively to the bands shows as a regular bullish divergence on %b.
This is a 2H chart of BTCUSD, Bitfinex - the same period as the previous one on 1D. Having bearish divergences on a longer timeframe and a bullish divergence on a shorter one shows a short recovery might be in the cards but the bulls aren’t winning yet.
Best Charting Tool for Divergences
For the ultra lazy? TradingView public library has a couple of automated divergence indicators. You won’t need to look for your divergences, the script will find them for you.
You’ll need an account to access the auto-divergence indicators, but TradingView FREE will be enough.
Other Resources On Price/Oscillator Divergences


