
This article uses free pine scripts from TradingView - sign up now and maybe go PRO on Black Friday?
Volume profile trading is one of the popular, but tricky trading styles. It’s also expensive: It needs large amount of market data and that’s not usually what charting apps want to give away for free.
Volume profile definition
Volume profile is a histogram that shows volume traded by price level.
A popular indicator is VPVR, or volume profile visible range, which re-paints your volume histogram as you move through the chart back in time.
There are other ways to do volume profiles too, such as showing a histogram for each trading day.
Tradingview’s Volume Profile Indicators
TradingView has several free alternatives in the public library. It is worth noting that all of them are estimates - they do not work with the exact live volume data on the market and so they will not be 100% accurate.
Most often, TradingView volume profile scripts will give you a single histogram for a selected time range. That is the so-called volume profile fixed range. It is easy to read but accumulates back in time.
So, unless you make notes into your chart, you will never be able to see the exact volume profile as it appeared let’s say last Monday. When checking volumes back in time, you will only get the histogram of the full timespan between now and last Monday.
That may be a deal-breaker, depending on your habits and style of trading. On the other hand, the only other option right now is volume blocks - one volume profile histogram per trading day.
That may or may not make sense in crypto, as crypto markets trade 24/7 and there are several hi-volume sessions that coincide roughly with certain times of the day in Beijing, London and New York.
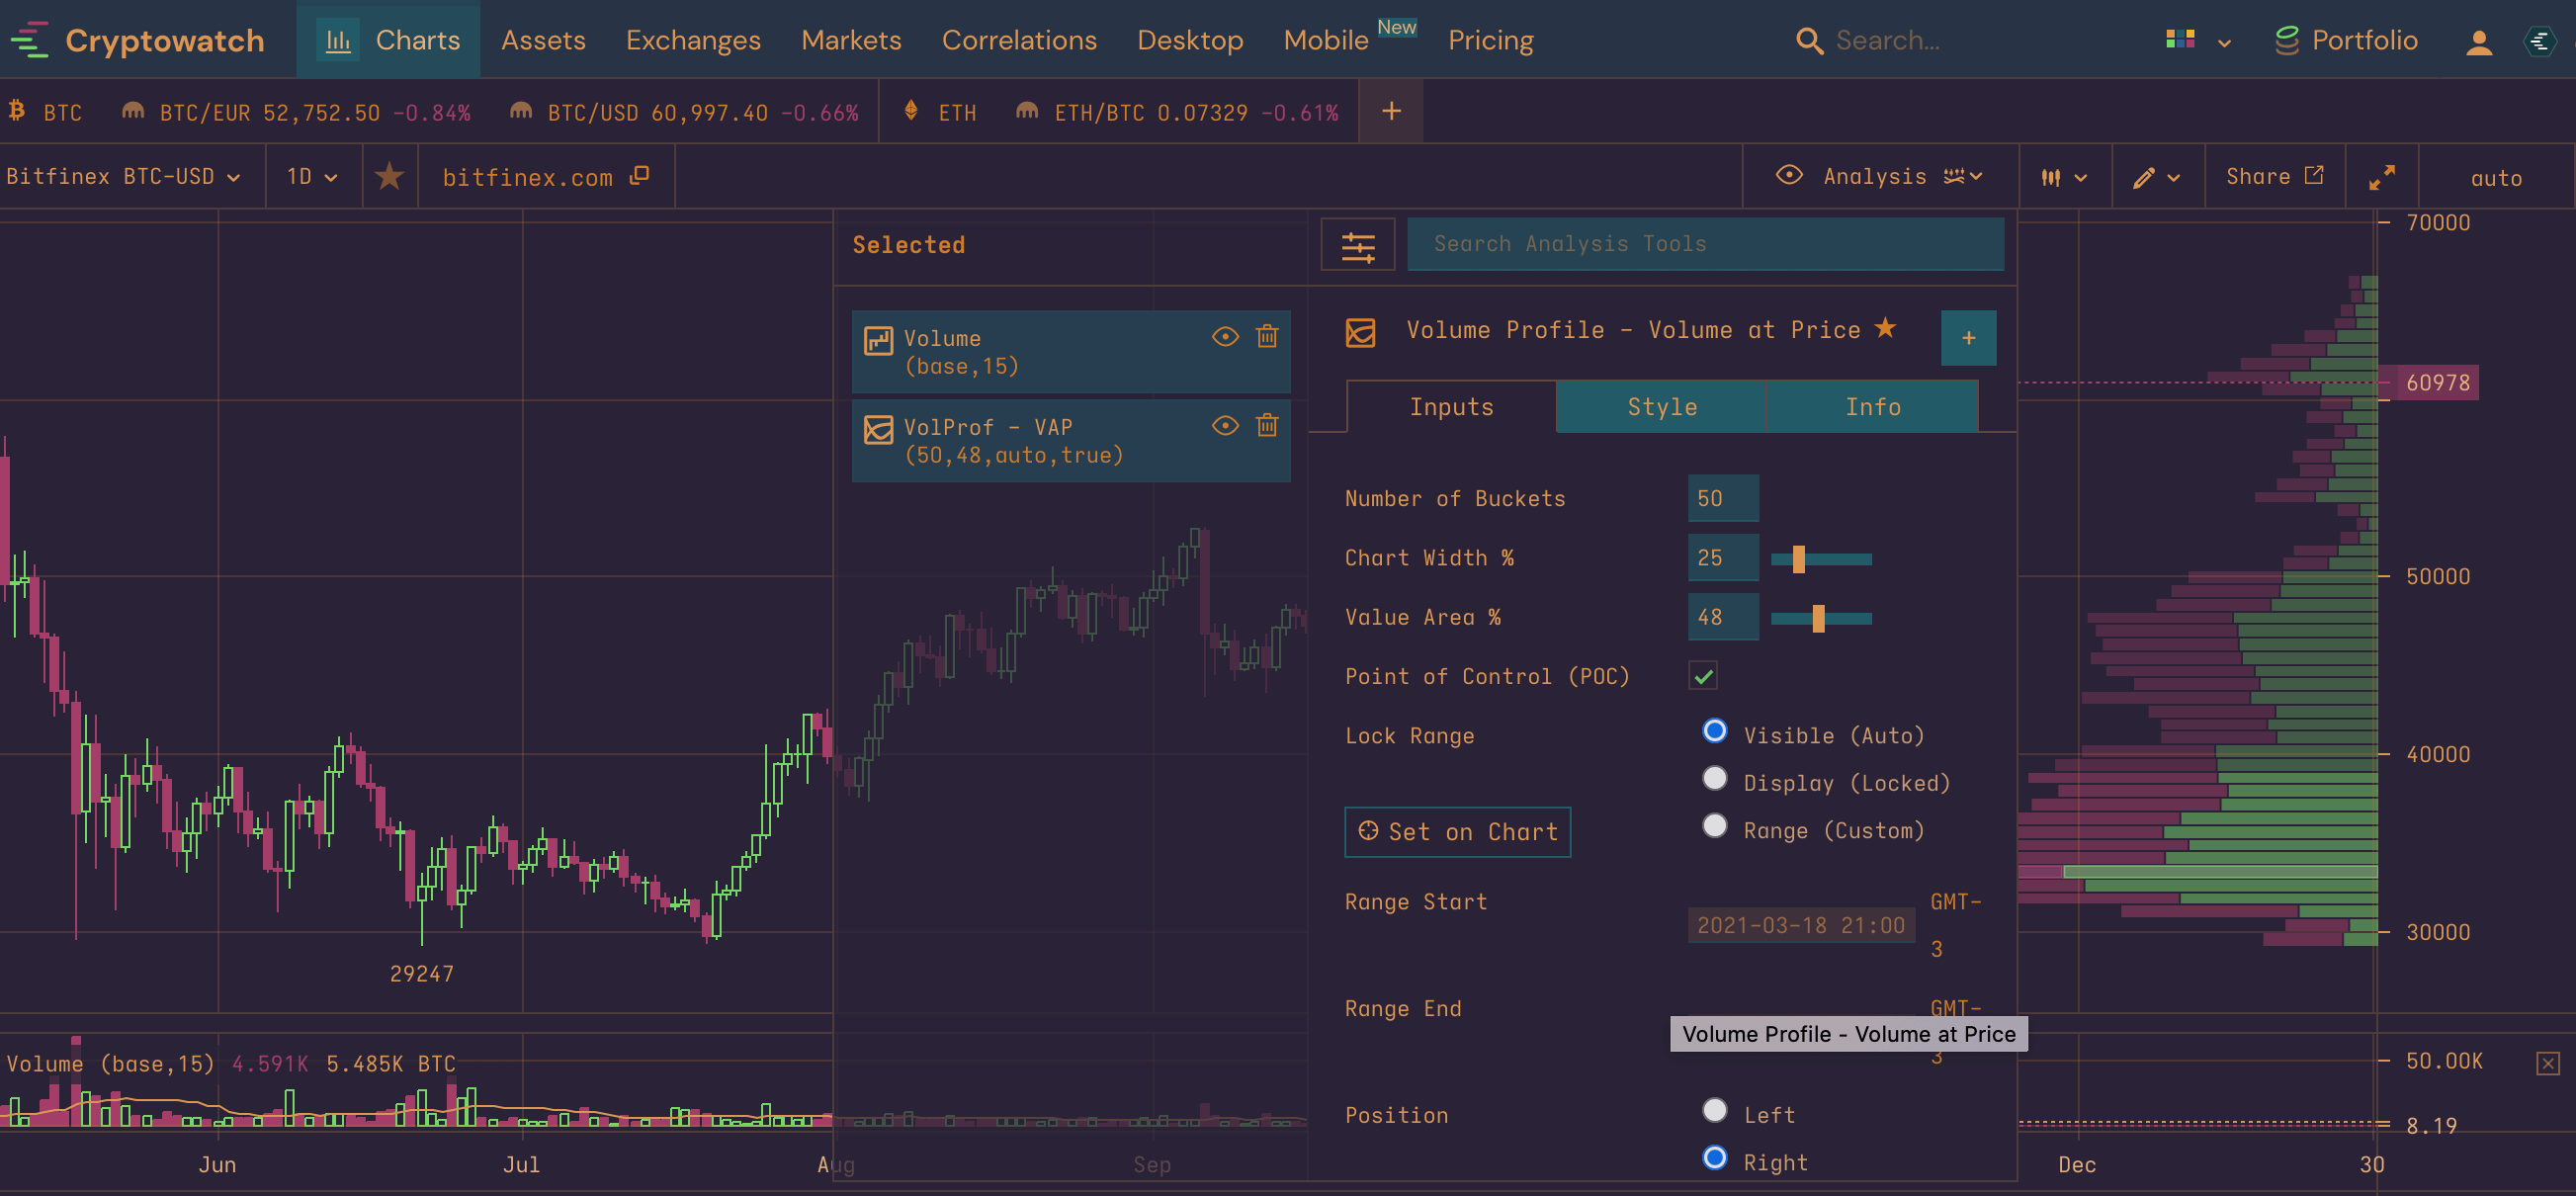
Cryptowatch has Volume Profile for visible chart range
…And so this is the first moment in the history of crypto trading where Cryptowatch delivers where TradingView is failing, and not the other way around.
Anyway, Cryptowatch in the website version has volume profile that (swiftly!) recalculates for your visible chart range.
The full range of technical analysis tools on Cryptowatch is still very limited, but if you want to trade volume profile for free, you will most likely need to check back with a Cryptowatch chart, at the very least.
Trading with Volume Profile
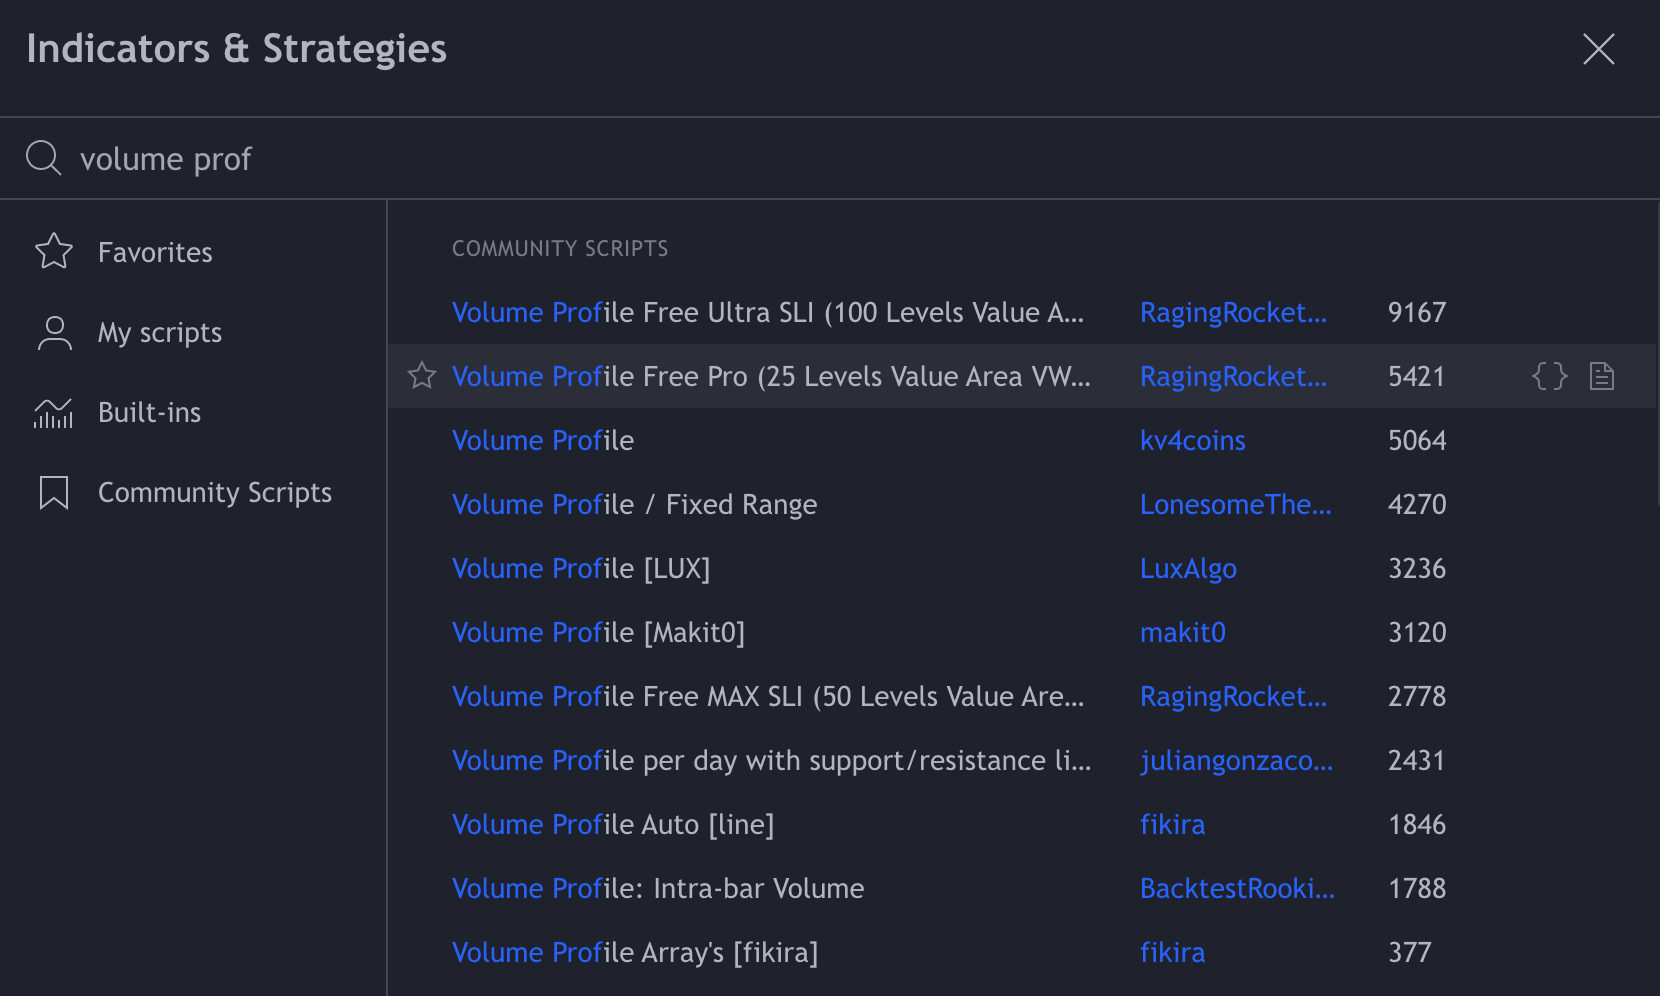
There are a bunch of “volume profile” indicators on TradingView, but the top ones were so data-heavy that they didn’t even render on my machine.
This is a problem traders complain about a lot even in the comments of the scripts I ended up using.
If you cannot render a volume profile indicator, go to its settings and lower the number of lookback periods or the numbers of rows (as in rows of price levels).
- Lower lookback period value will place the histogram closer to current price action. This is because it will use shorter time span to calculate the traded volumes.
- Lower rows value will make the histogram sparse. The price-volume levels will be farther apart.
Volume Indicators used in this ScriptSpotlight
- Volume profile fixed range by LUX on TradingView. This is a fixed range histogram that works ok on crypto charts in default settings. It was developed in 2021 specifically for crypto.
- Volume profile per day by juliangonzaconde on TradingView. This has optional support and resistance lines which you will have to tweak a lot or switch off for crypto: the script was developed on a legacy index market and cannot handle the volatility of crypto too well in default settings.
- Cryptowatch VolProf with Lock Range set to “visible”.
I encourage you to test all three of the indicators and see how comfortable you are working with each of them.
Each of them has pros and cons and needs to be traded in a certain way. I think it will be clearer with examples to show you what’s a long setup and what’s a short setup with volume profiles.
To make it clear what you are looking at, I will first list out the three common volume profile patterns you will need to search for regardless of the style of your volume profile.
How to Read Volume Profile Patterns
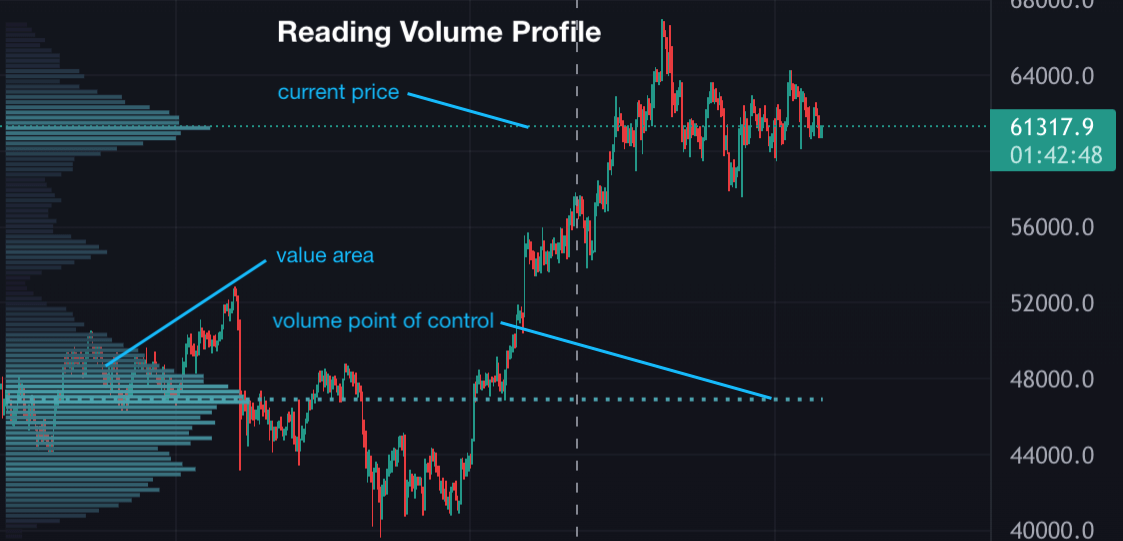
In any iteration of volume profile, you will get a vertical histogram on a side of your chart.
The histogram will get highlighted through one part - those are the prices of higher traded volume, or the value area.
Somewhere around the middle of the value area, the histogram will give you a horizontal line. That’s the price of highest traded volume, or the (volume) point of control - shortened POC, or VPOC.
In a balanced market that is going perfectly sideways, the value area and POC will be around the middle of the histogram. In markets that are trending or taking a breather before trending, the value area will be shifted upwards or downwards.
-
“p pattern”
The high volume area is near the highest price of the timespan for which your volume profile was calculated.
-
“b pattern”
The high volume area is below the highest price of the timespan for which your volume profile was calculated.
-
“B pattern”
There are two high volume areas in the range you are using, one at the top and one at the bottom. Wheread in p and b patterns the POC area of the chart is most important, in B patterns it is often the lowest volume zone (or the “gap”) that is worth considering.

First look: LUX’s Fixed Range Volume Profile
I will start with Volume profile fixed range by LUX on TradingView. This is what it looks like in the default settings:
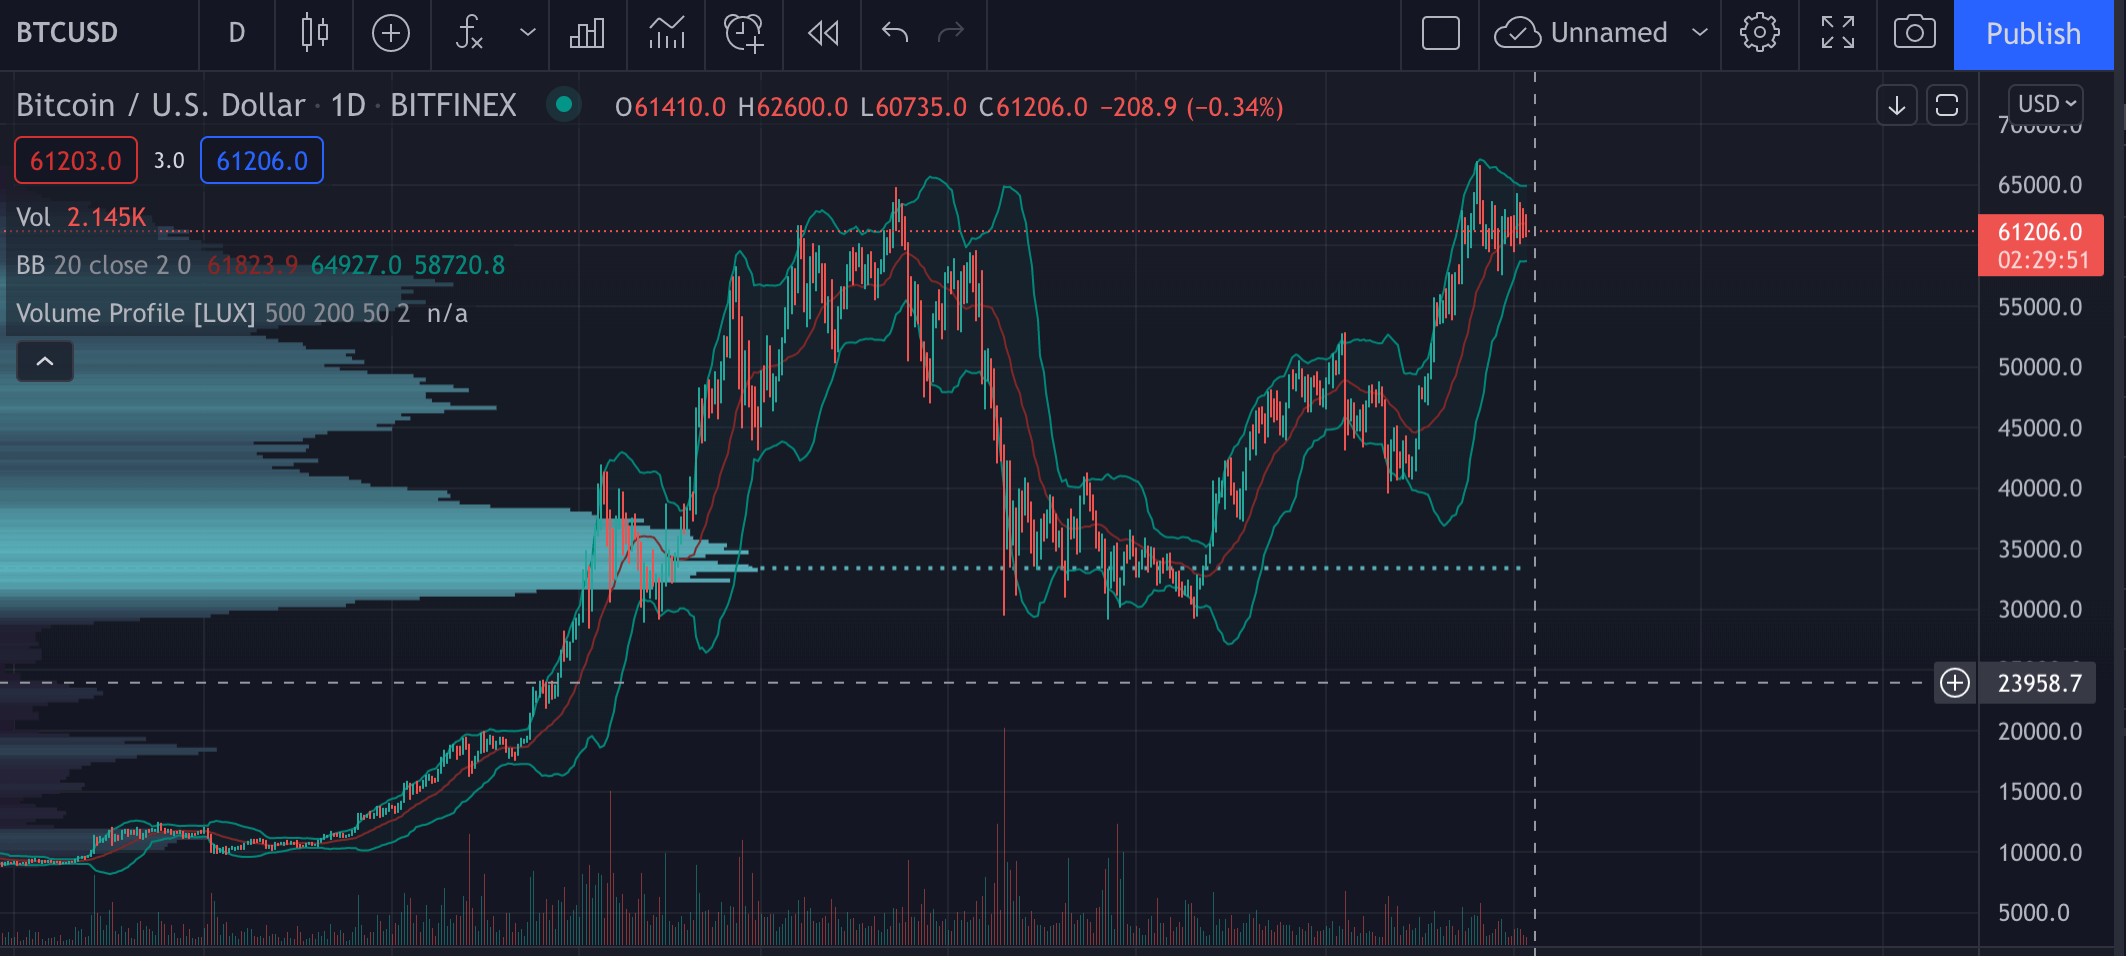
Figure 1 - Volume profile fixed range by LUX on TradingView
You see it renders to give you a histogram pretty much over the visible range of the chart.
The range is fixed by the number of candles, so you can go ahead and switch to other timeframes to get the same type of view. The time span used will be different, but the number of candles used the same.
Trading with LUX’s Volume Profile
The disadvantage of fixed range volume profile is that it can easily show you a skewed snapshot of the market.
Figure 2 shows what you get for lookback of 250 and 100 rows gives on the 4H BTCUSD chart.
In this case, the settings of 250 just about captures the latest leg up and the consequent flag. You see that there was very low volume on the actual advance (typical of crypto) and the high volume area is around the current flag.
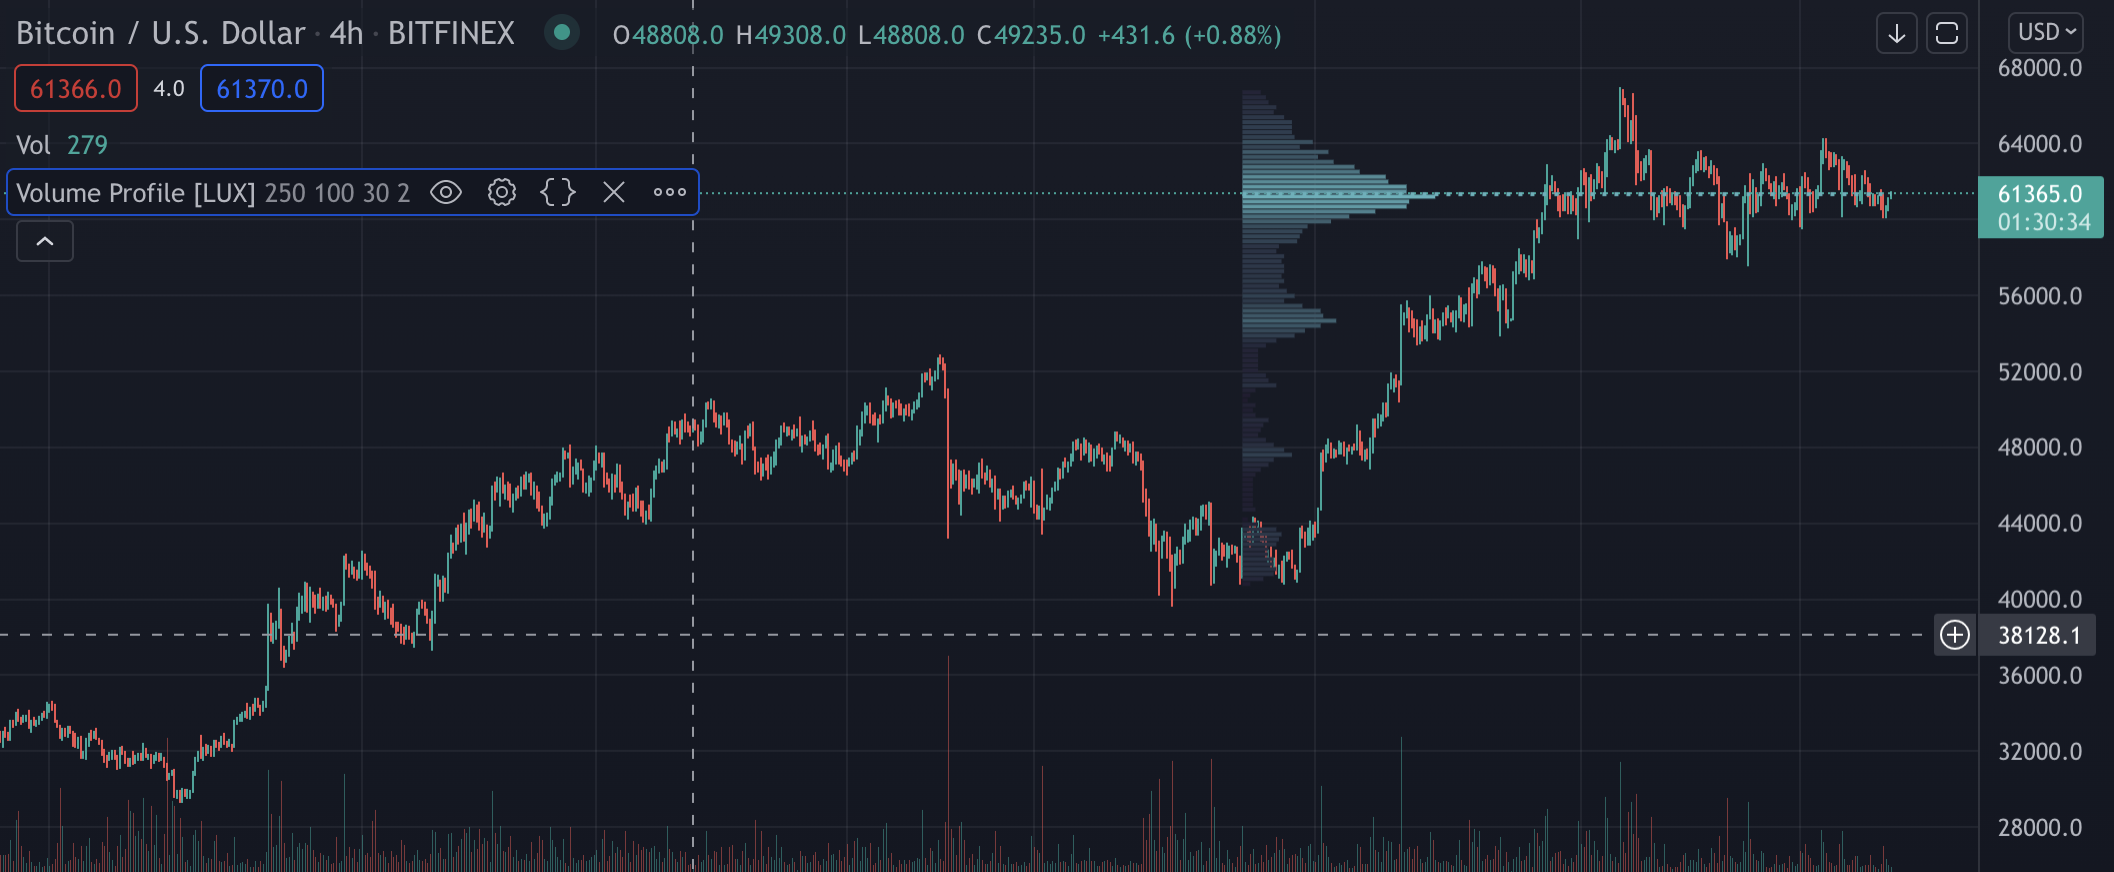
Figure 2 - 250 lookback - Volume profile fixed range by LUX on TradingView
The standard reading of volume profile will say that this is a p-pattern, a bull flag with healthy volume distribution, and that’s likely a continuation.
But let’s now look what happens if you change lookback just by 50, to 300.
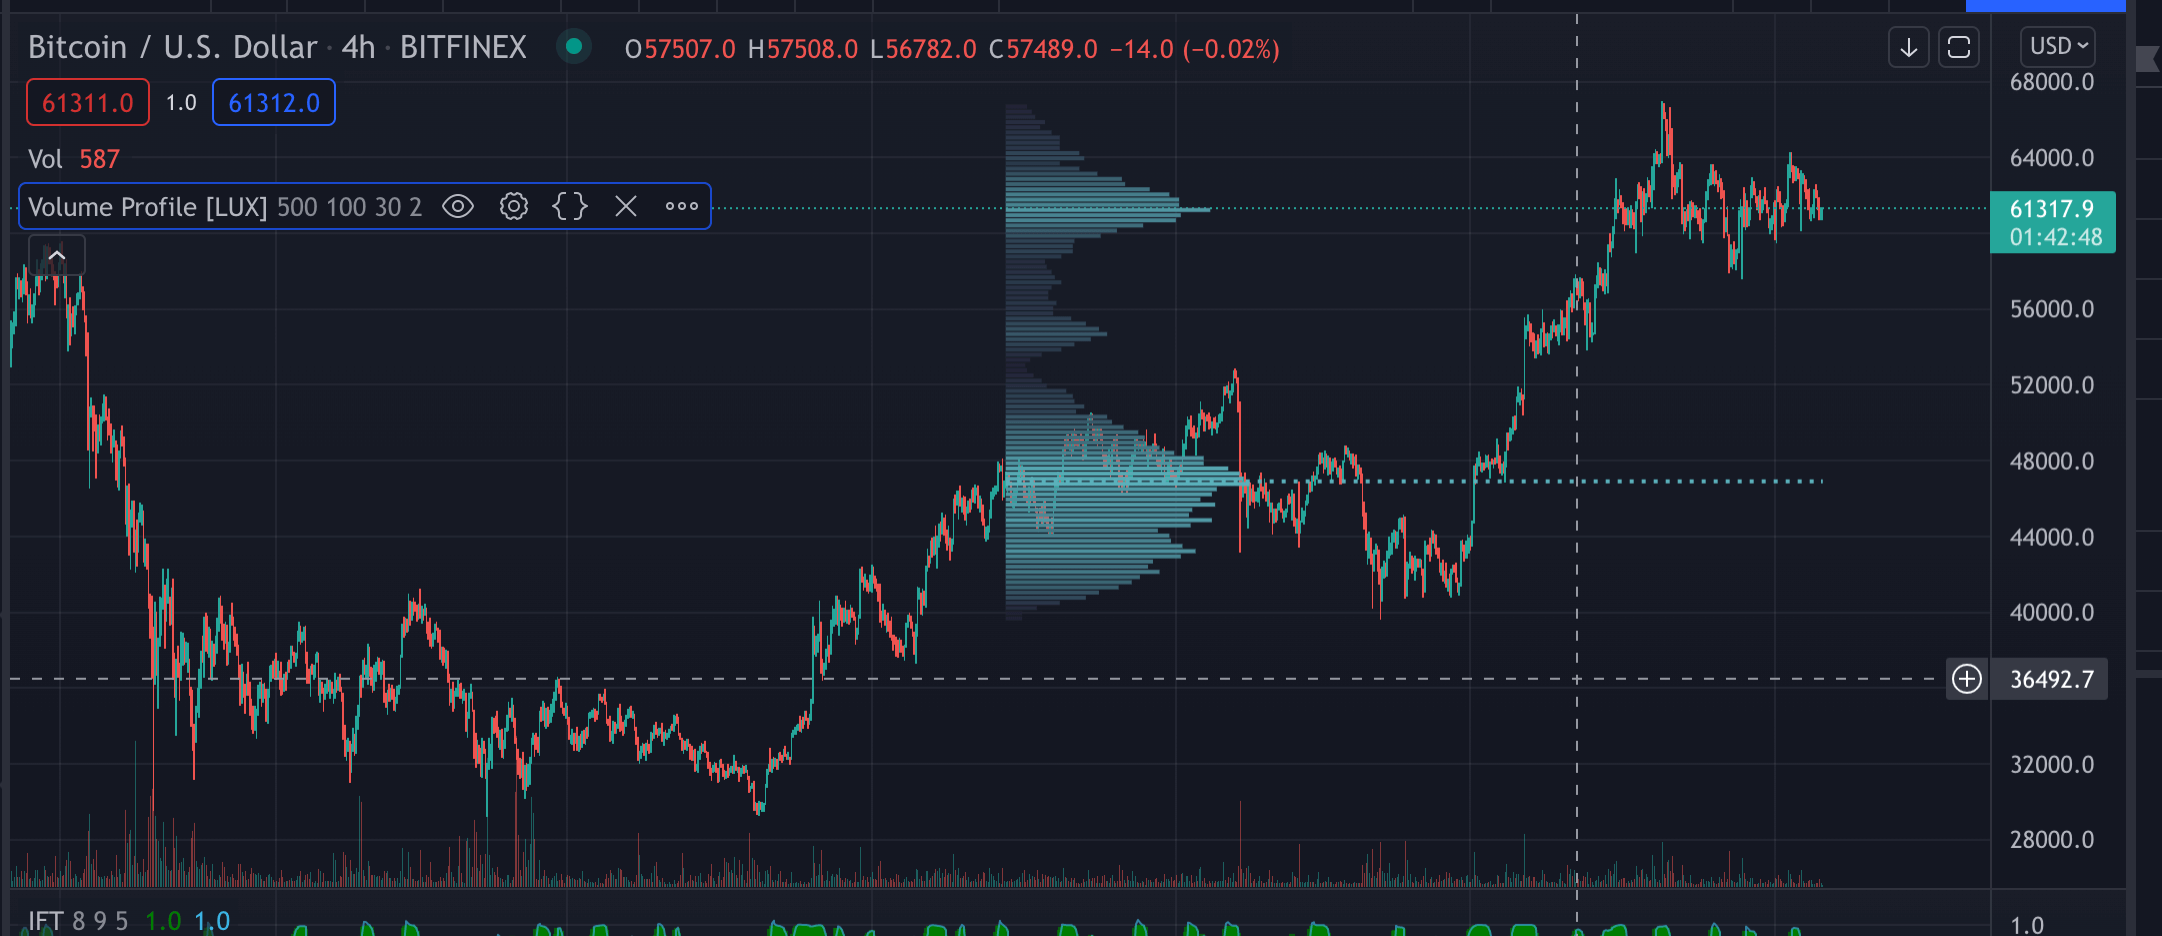
Figure 3 - 300 lookback - Volume profile fixed range by LUX on TradingView
On Figure 3 you can see that suddenly it is the B-pattern, with two high volume areas. This is because now the volume profile picked up the tail of the previous flag.
The standard reading of a B-pattern would say that the market may want to retrace to the lowest volume area and bounce from there. This is the somewhat infamous expectation of “filling the gap”.
What gives?
You need time records
To trade volume profile reasonably, you need comparison between different time periods.
Using fix range profile, you will have to check it at regular intervals, with the same lookback value, and make notes on the chart to mark that day’s value area and POC.
If you simply increase your lookback, it won’t be the same thing because your histogram will always count back from the present moment.
A bit prehistoric, but you get what you pay for.
Why the daily volume profile may be easier to read
The reason for getting the comparison is that you need to see how the volume profile developed over time to gauge the type of the market. Think of it this way: The traded volume in the value area is just volume, it doesn’t have a direction. They are trades made, each one of them with a buyer and a seller.
To get directional information, just look at your previous time periods. Example: Last high-volume block was at price X, how did traders react? - The buyers ended up prevailing, because at the moment the market is trading higher.
The interpretation of this is not set in stone either, I warn you. If you’ve ever heard of Steidlmayer’s market profile, you probably get it. Continuing the last example:
- What is the mood on the market, now that buyers have got the upper hand?
- Is this the kind of market that is “reactive” and will now sell off back to some mean value?
- Or does the market have the “initiative” and will just keep making legs up?
Getting strictly bound data is helpful
Here the alternative TradingView’s volume profile might be of use: Volume profile per day by juliangonzaconde on TradingView paints one histogram per trading day, which is from midnight to midnight UTC globally. This is useful in that it gives uniform chunks of time, but it only does 24-hour spans which means you won’t get reasonable data from it on long time-frames. On a 1D chart it will give you one POC per each candle.
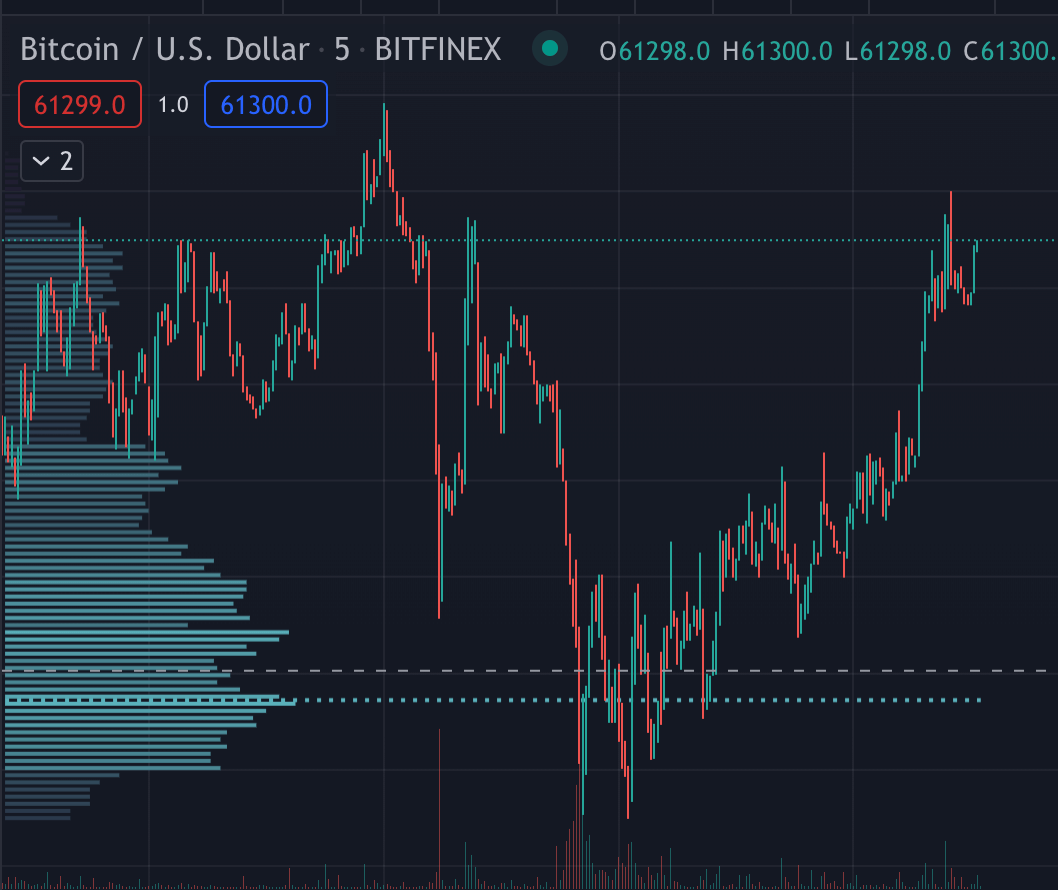
But on a 1h chart or lower you will get data that is easy to understand - see Figure 4: On 2 Nov the POC was around 63000 USD. What did traders do? Ended up shorting it. The day after? POC was still too high. The 5th and 6th of November? The POC stayed almost the same, some buyers must have shown up at these levels.
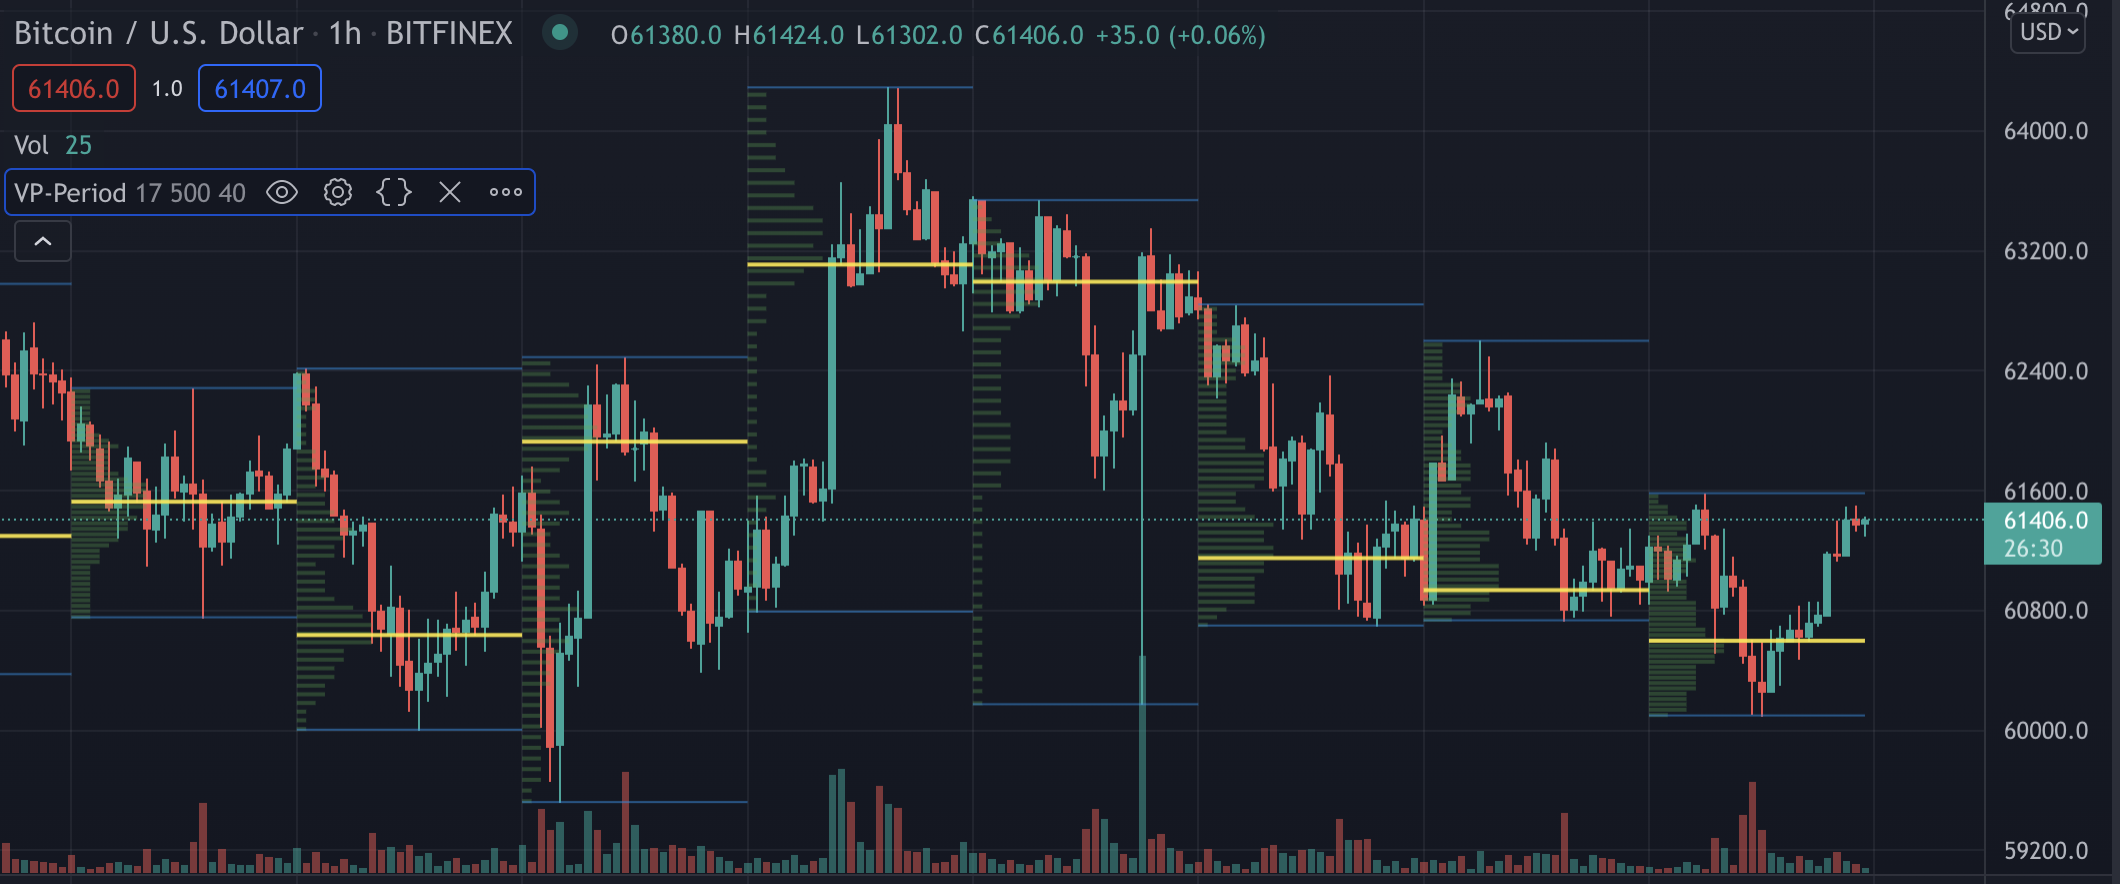
Figure 4 - Volume profile per day by juliangonzaconde on TradingView
The LUX’s fixed range script actually offers an optional POC line rendering that kind of simulates the historical development of the volume profile. On Figure 5 it is shown as the red line.
It needs a bit to wrap your head around how to use it, but it is essentially just supply vs demand thinking: Did the POC act as a support, or as a resistance?
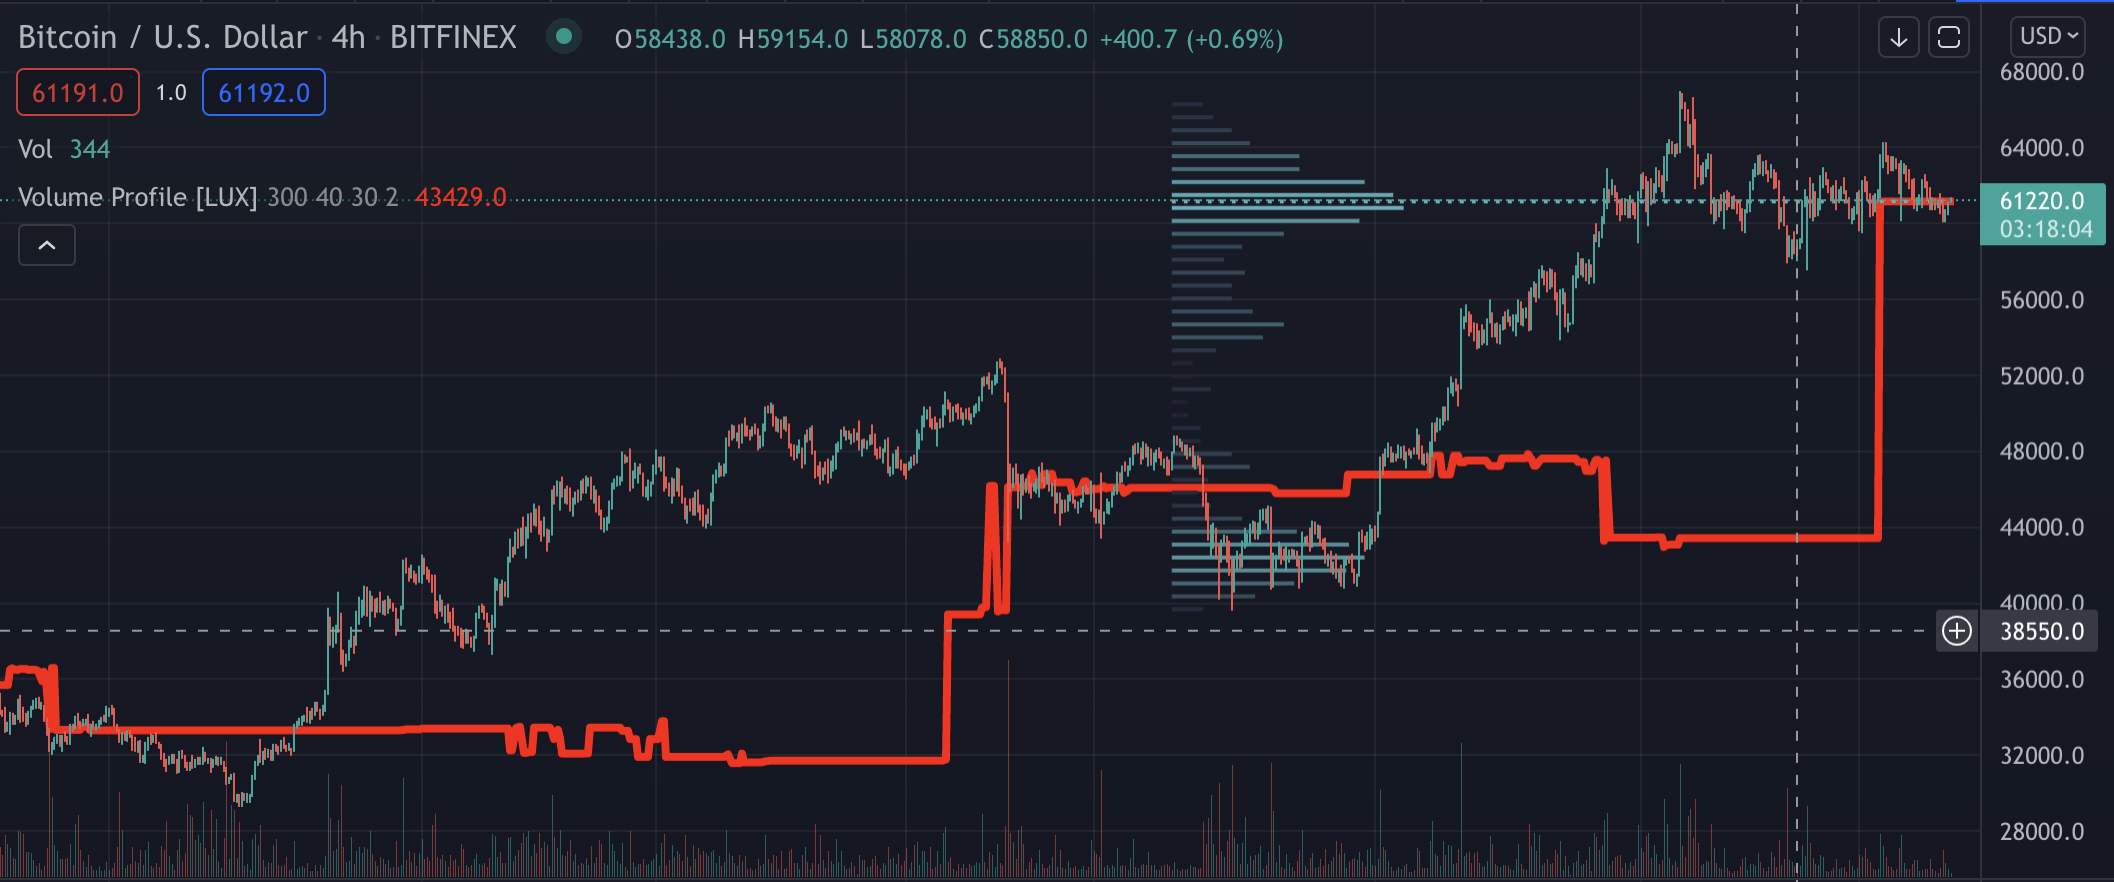
Figure 5 - POC charting - Volume profile fixed range by LUX on TradingView
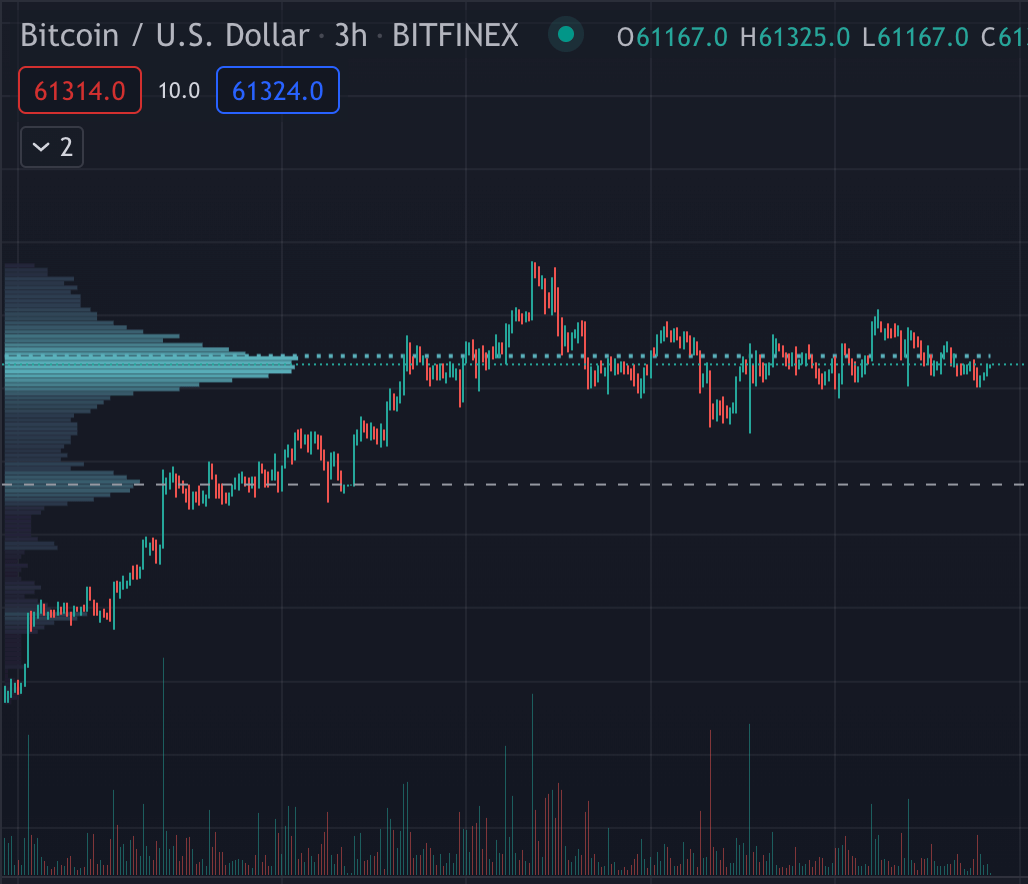
For more fluid data you will need to go to Cryptowatch, or at least double check back with it. The volume profile there is just the plain visible range. It will show you the full histogram as it develops in time.
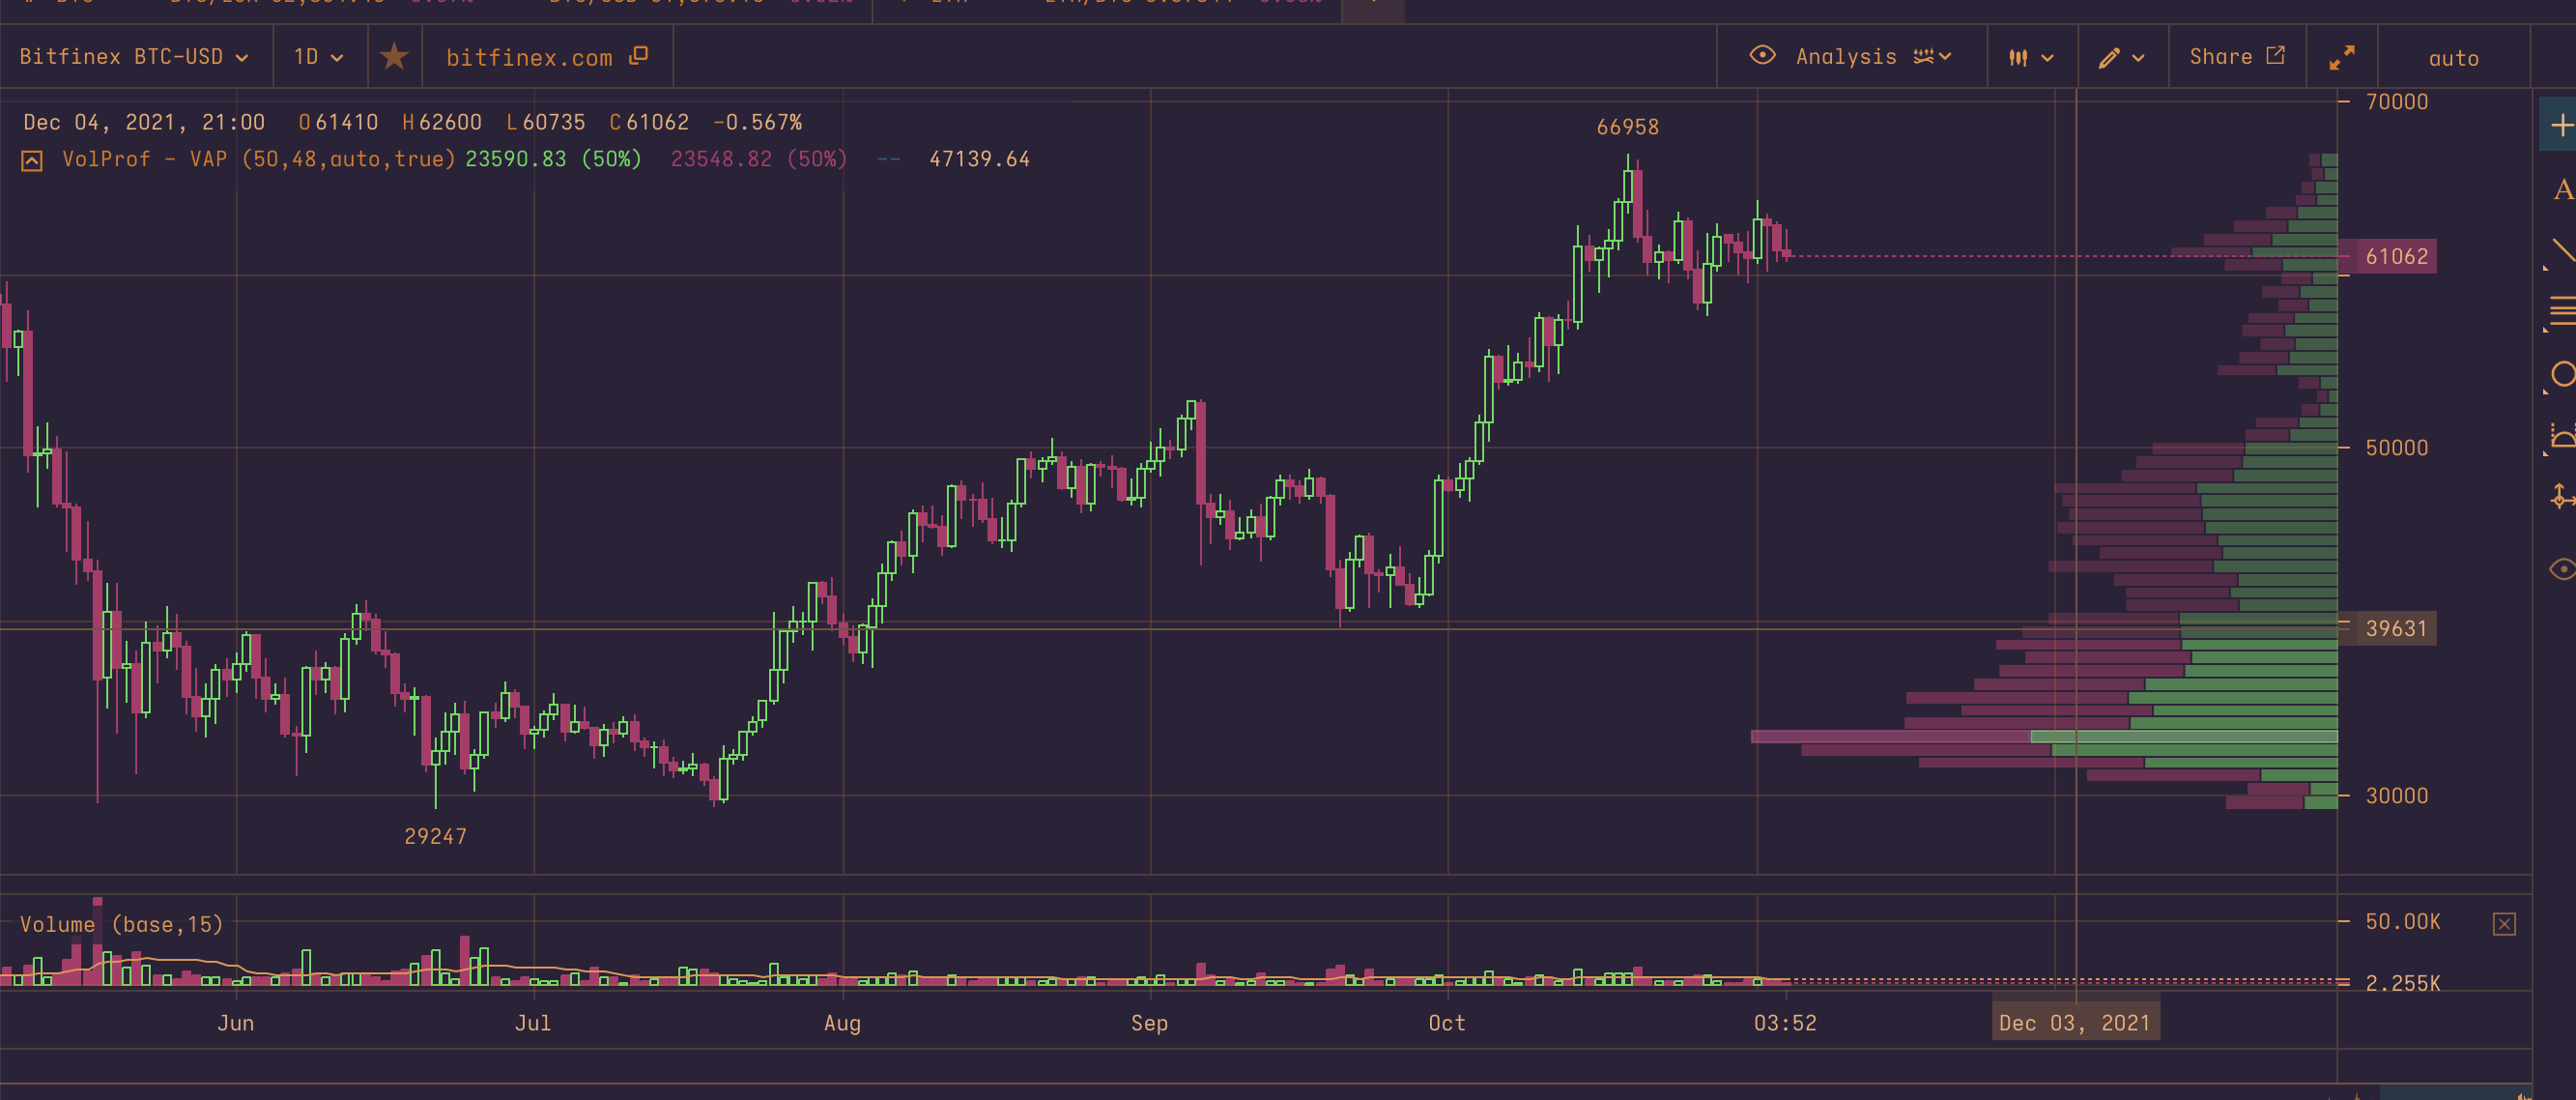
Figure 6 - Cryptowatch
Keeping your eye on the price action and on the high volume area at the same time, you will be able to see which side of the market ended up prevailing in the high volume ranges. But be careful - having too much freedom in your charting can make you paint the picture you want to see.
Conclusion
From my point of view, the daily volume blocks are the most useful to analyse the market for the longer run and getting the bigger picture.
The fix range or visible range volume profiles on the other hand give much better information for short-term charting and trading. Filling of the gap is also something more likely to happen on your 15 minute time frame than in a massive weekly range.