
VPVR (Volume Profile Visible Range) paints a histogram of traded volume at each price level across the visible chart window. It’s a popular volume trading tool that reveals where the market has spent time and where liquidity concentrations exist.
This article covers volume profile trading—both manual strategies and automation approaches.
In this trading strategy:
- Where to access VPVR: Free charting platforms
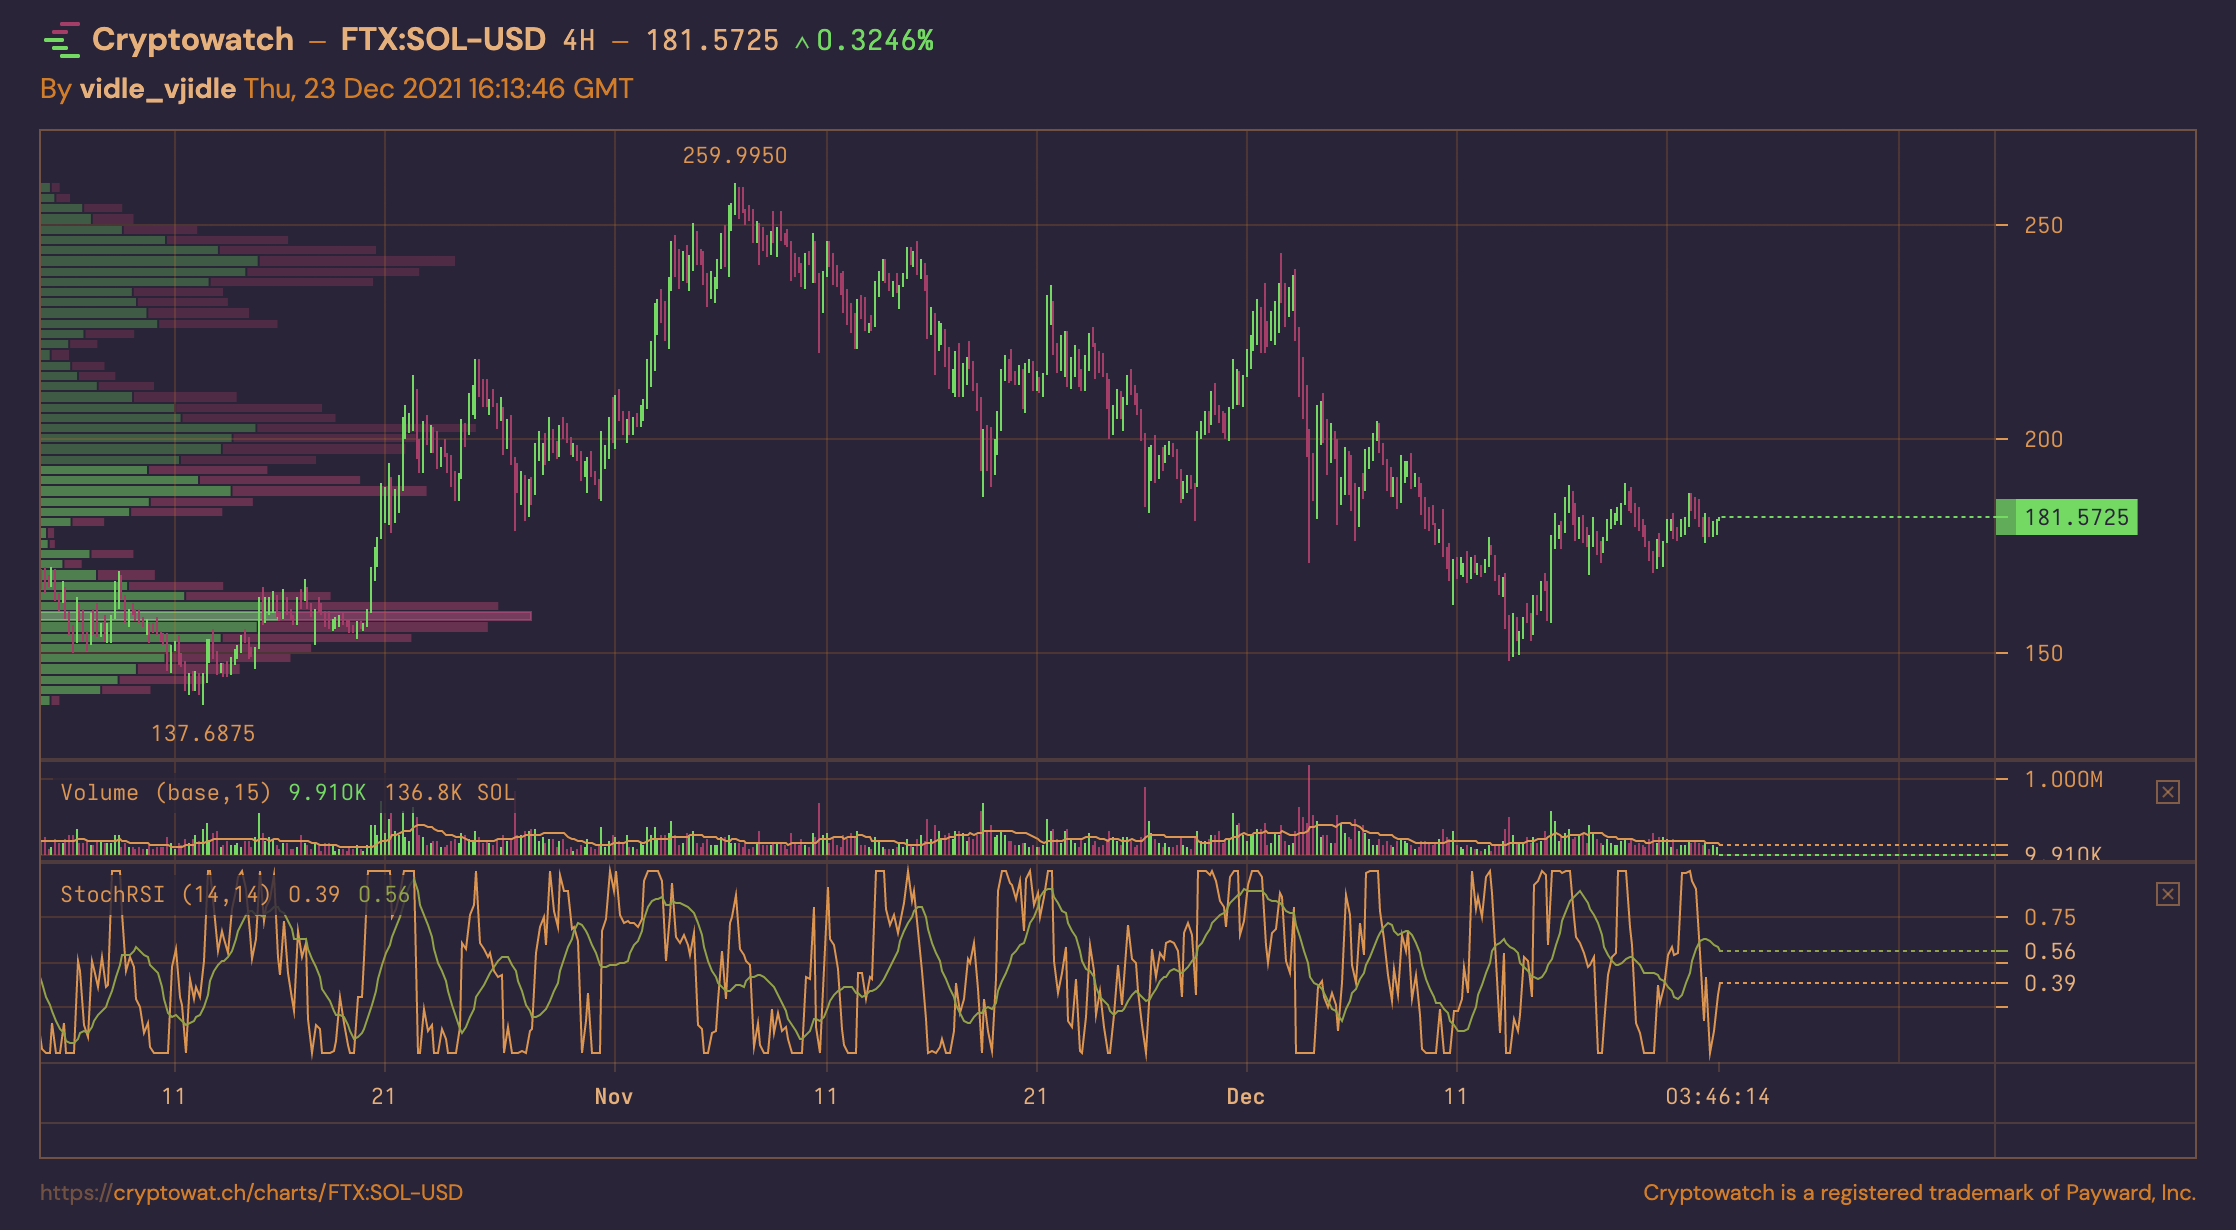
- Cryptowatch for visible range profiles
- TradingView for fixed range profiles
- How to read VPVR indicator
- Best manual volume profile strategies:
- How to automate volume trading
Platforms for VPVR Trading
VPVR used to require premium subscriptions. As of 2025, you can access free versions on major charting platforms.
Cryptowatch offers free visible range volume profiles. You can also import exchange API keys to trade directly from Cryptowatch charts.
TradingView has excellent free volume profile scripts (fixed range). For short-term trading (3H charts or shorter), daily fixed range volume profiles work particularly well—one profile per trading day.
Here’s a link to a solid free daily fixed range volume profile on TradingView.
How to Read Volume Profile
Reading VPVR boils down to three elements:
-
Find the highest traded volume price (VPOC - Volume Point of Control)
This approximates supply and demand equilibrium, which often acts as support or resistance. The histogram highlights the value area—the price range containing the majority of volume.
-
Identify volume gaps
Price levels with minimal volume suggest the market passed through quickly, often during irrational moves. These gaps tend to “fill” later as price revisits.
-
Verify data quality
Both fixed and visible range profiles let you scroll through history. Be cautious: depending on where you stop scrolling, you’ll get different patterns—some meaningful, some meaningless.
Visible range profiles work best for traders actively watching charts who understand how the profile developed.
Fixed range profiles (especially daily) are safer for systematic trading since you’re comparing consistent time windows.
Fixed Range Volume Profile Trading Strategies
Fixed range volume profiles excel for day traders and short-term speculators. Set your range to daily to capitalize on regularities in trading activity.
The core strategy: compare today’s price action vs. yesterday’s high-volume areas (value area) to gauge market sentiment shifts.
- No complex patterns needed—just comparison between consecutive days
- Use additional indicators for timing: MACD, EMAs, RSI
- This is short-term trading: use stops, close positions decisively
Trade on 1H charts or shorter. Anything above 3-4H won’t show enough detail for daily profiles.
Bullish Setup (Daily Fixed Range)
Conditions: Today’s trading opens above yesterday’s value area (but not completely above the entire profile).
Interpretation: Strong demand, but not pure FOMO. Likely to test new highs.
Strategy: Wait for retracement from the high attempt, then buy the retracement.
Risk management:
- Stop loss: yesterday’s value area
- Move to breakeven quickly
- Target: next resistance or short-term top
- Use market stops for quick exits
Bearish Setup (Daily Fixed Range)
Conditions: Today’s trading opens below yesterday’s value area (but not a total collapse).
Interpretation: Weakness establishing. If price retests yesterday’s value area and gets rejected, that’s a short setup.
Strategy: Short the rejection of yesterday’s value area.
Risk management:
- Stop loss: above old resistance
- Move stop into profit as price drops
- Watch oscillators (Stoch RSI, IF RSI) for reset or take profit at next support
Context awareness: Always check the broader trend. Shorting in a strong uptrend requires discipline—exits must be faster.
Visible Range Volume Profile Trading Strategies
Visible range profiles accumulate volume data across the entire chart window. This makes them excellent for identifying support and resistance at a glance.
VPVR suits both scalping and swing trading since you’re working with support/resistance levels regardless of timeframe.
Key limitation: When price is at all-time highs (ATH), there’s no historical volume data above. Use Fibonacci extensions (TradingView has an AutoFib script) and orderbook heatmaps (Tensorcharts, Bookmap) to anticipate resistance above ATH.
VPVR Support & Resistance Analysis
For swing trading, combine VPVR with oscillators (RSI, Stoch-RSI) on 4H or daily charts.
What to look for:
- High-volume areas = strong support/resistance
- Volume gaps = weak zones likely to be traversed quickly
- VPOC (volume point of control) = equilibrium, often pivotal level
Example workflow (4H chart):
- Identify current price relative to VPOC and value area
- Check if recent rallies made higher highs or lower highs relative to value area
- Observe RSI: Is it showing strength or weakness relative to price action?
- If price is testing value area on high volume: key decision point
- If price falls below value area on high volume: bearish signal
For assets showing weakness, either move to stronger opportunities or set alerts for value area breaches and monitor fundamentals.
For 1D charts: Incorporate fundamental analysis. Technical setups matter more when fundamentals support them.
Automating Volume Profile Trading
Automating VPVR is challenging due to its fluid, visual nature. For automation, use fixed range volume profiles or simpler volume tools like OBV (On-Balance Volume).
As of 2025, popular auto-trading platforms (Shrimpy, Coinrule) don’t support volume profile indicators natively. You’d need to implement simplified versions yourself.
Simplifications for Automation:
- Extract only the VPOC (highest volume price) from daily data—you don’t need the full profile
- Use daily OHLC data to get high, low, and midpoint
- Define value area statistically (e.g., VPOC ± percentage threshold)
- Trigger trades on rejection from value area (e.g., price approaches VPOC+5%, then reverses)
- Always include trailing stops
Automating Simpler Volume Trading
Approach: Use platforms with native automation (Binance [finance:Binance Holdings Ltd.], OKX, Bybit “trading bots”) or dedicated quant zones.
Example strategy: Sell when price stays below known resistance without breaching it, while daily volume rises above a threshold. This suggests distribution—increasing sell volume without price appreciation.
Suitable for: Larger assets (BTC, ETH) that range rather than smaller alts prone to violent moves.
Implementation (generic exchange quant tool):
- Define resistance level (e.g., $4,790 for ETH near ATH)
- Set price condition:
(price < resistance - buffer) - Set volume condition:
(volume_last_60_min > average_hourly_volume_24h) - Refine: Tighten or loosen volume threshold (
> 2x averagefor stricter filter) - Action: Market sell spot, or open short hedge position
Add additional conditions to verify weakening momentum (e.g., successive lower highs, declining volume on bounces).
Summary
Tools mentioned:
- Free daily volume profile (TradingView)
- Free VPVR on Cryptowatch
- AutoFib script (TradingView)
- Tensorcharts orderbook heatmap
Key takeaways:
- Fixed range volume profiles (especially daily) are easier to trade systematically and automate
- VPVR (visible range) excels for manual support/resistance identification
- Simple volume tools (OBV, volume thresholds) are more practical for algorithmic trading
- Always combine volume analysis with broader market context and risk management
Volume profile trading isn’t about finding magical patterns. It’s about understanding where the market has established value, where it hasn’t, and positioning accordingly with disciplined risk management.