
VTrend is a volume trading strategy with a bunch of features packed into a single TradingView script.
On the face of it VTrend looks a bit like Ichimoku cloud but it’s made of different market metrics. It still gives a lot of information at a single glance.
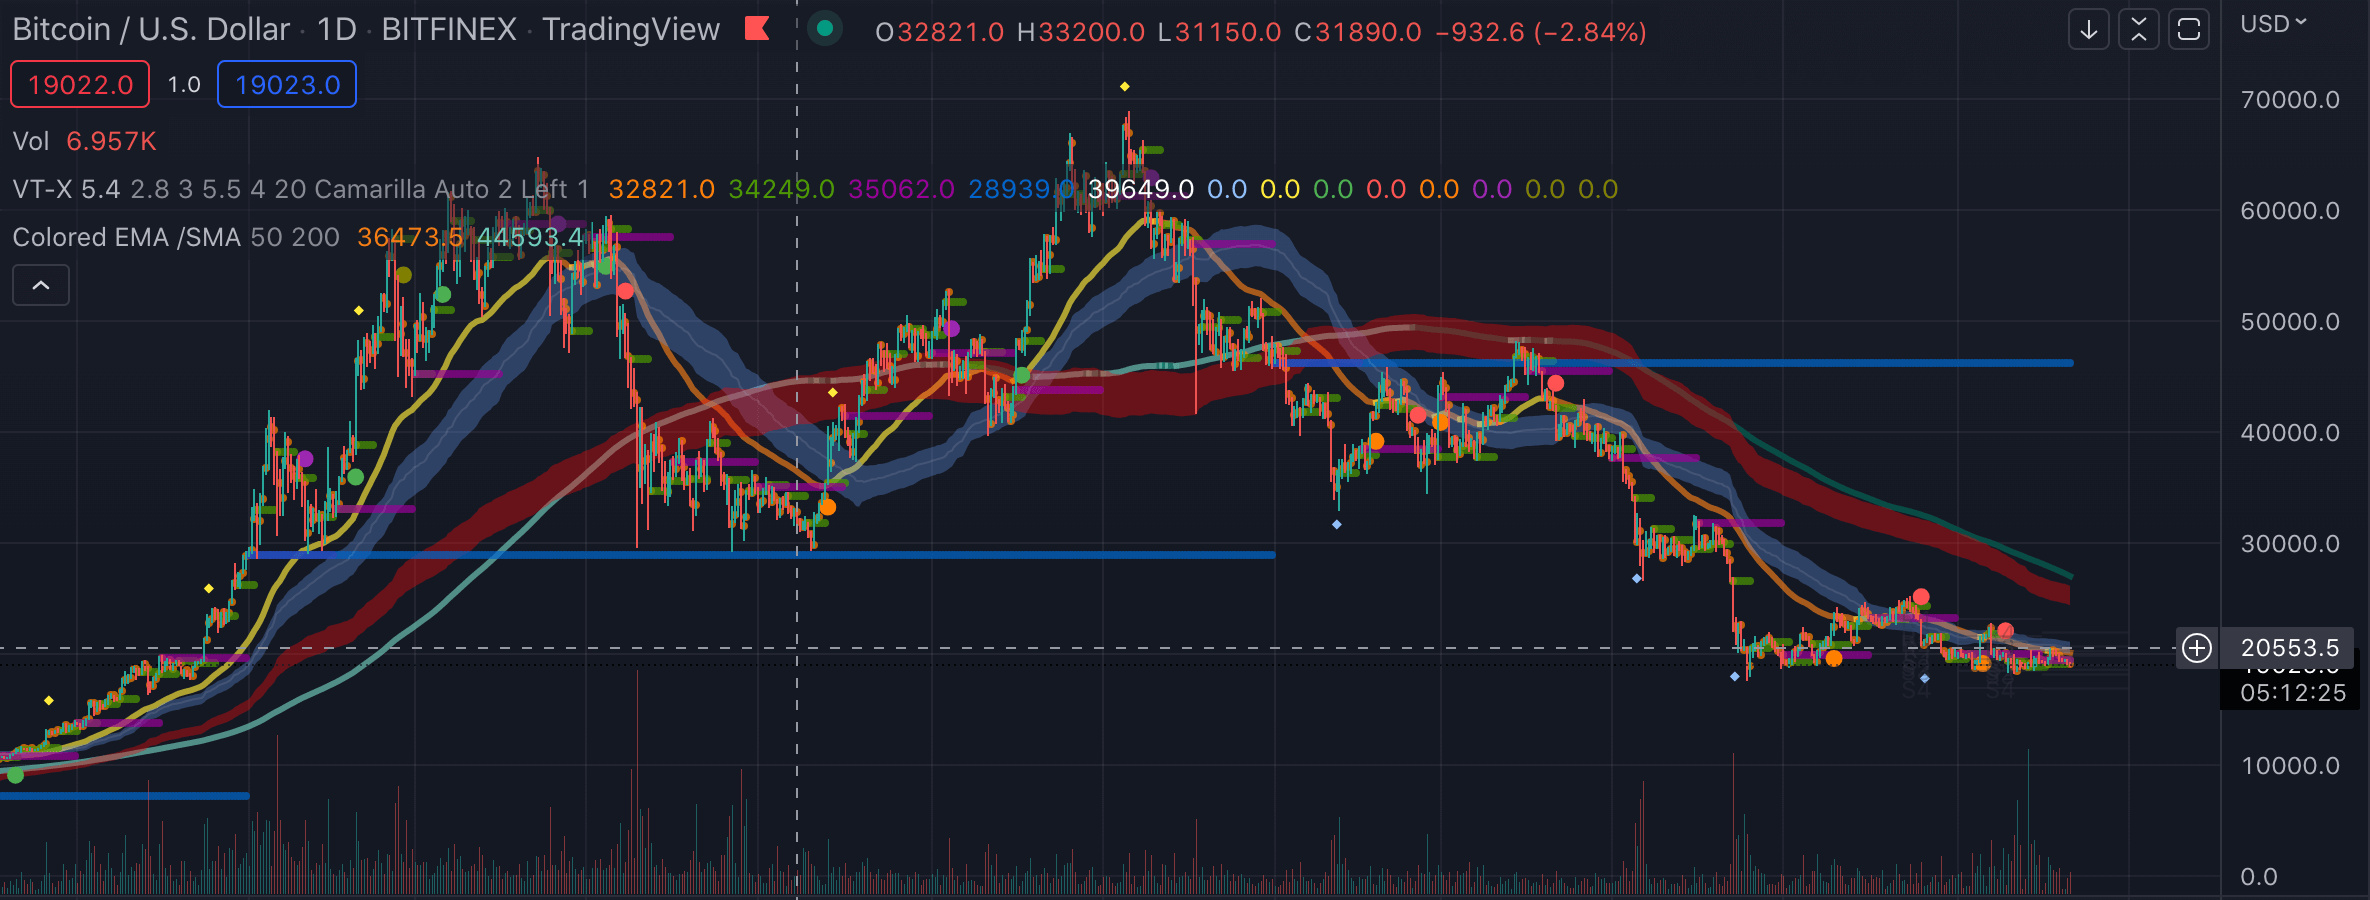
This is what it looks like:

You can use VTrend in TradingView’s free tier as well - make an account if you don’t have one.
VTrend is a premium script that costs 420 USD per year with shill link.
I’ll first go over the elements you see on the VTrend chart and then make an example of how to read and interpret that.
Volume-weighted bands for support and resistance
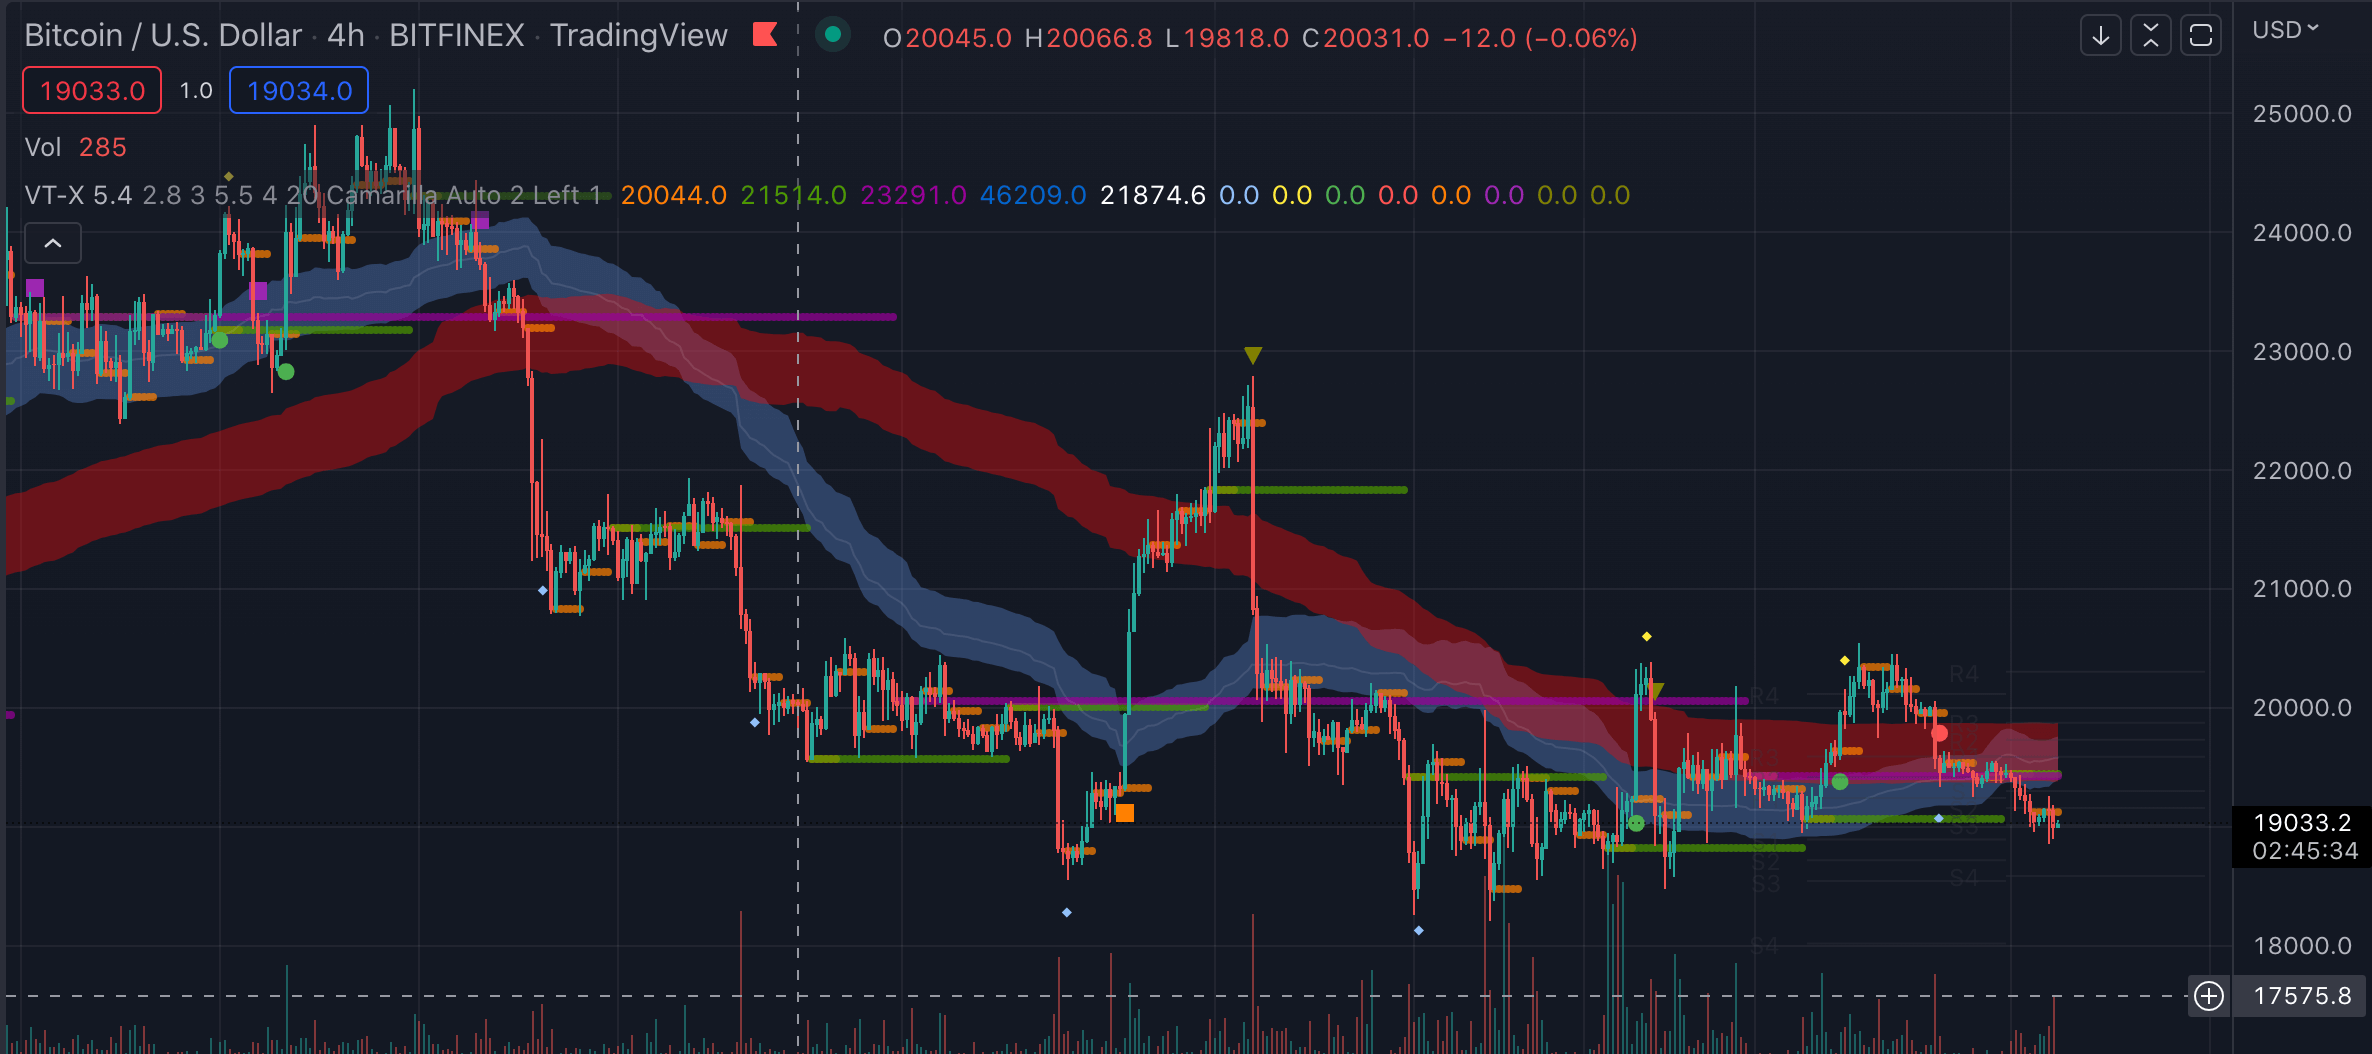
The first feature you’ll notice are the volume-weighted bands - the blue and red bands that look a bit like Ichimoku cloud.
Reading the bands is similar to reading moving averages in the fast vs slow chart setup: You look for crossovers. When the faster blue band crosses below the slower red band, it confirms the market is in a downtrend.
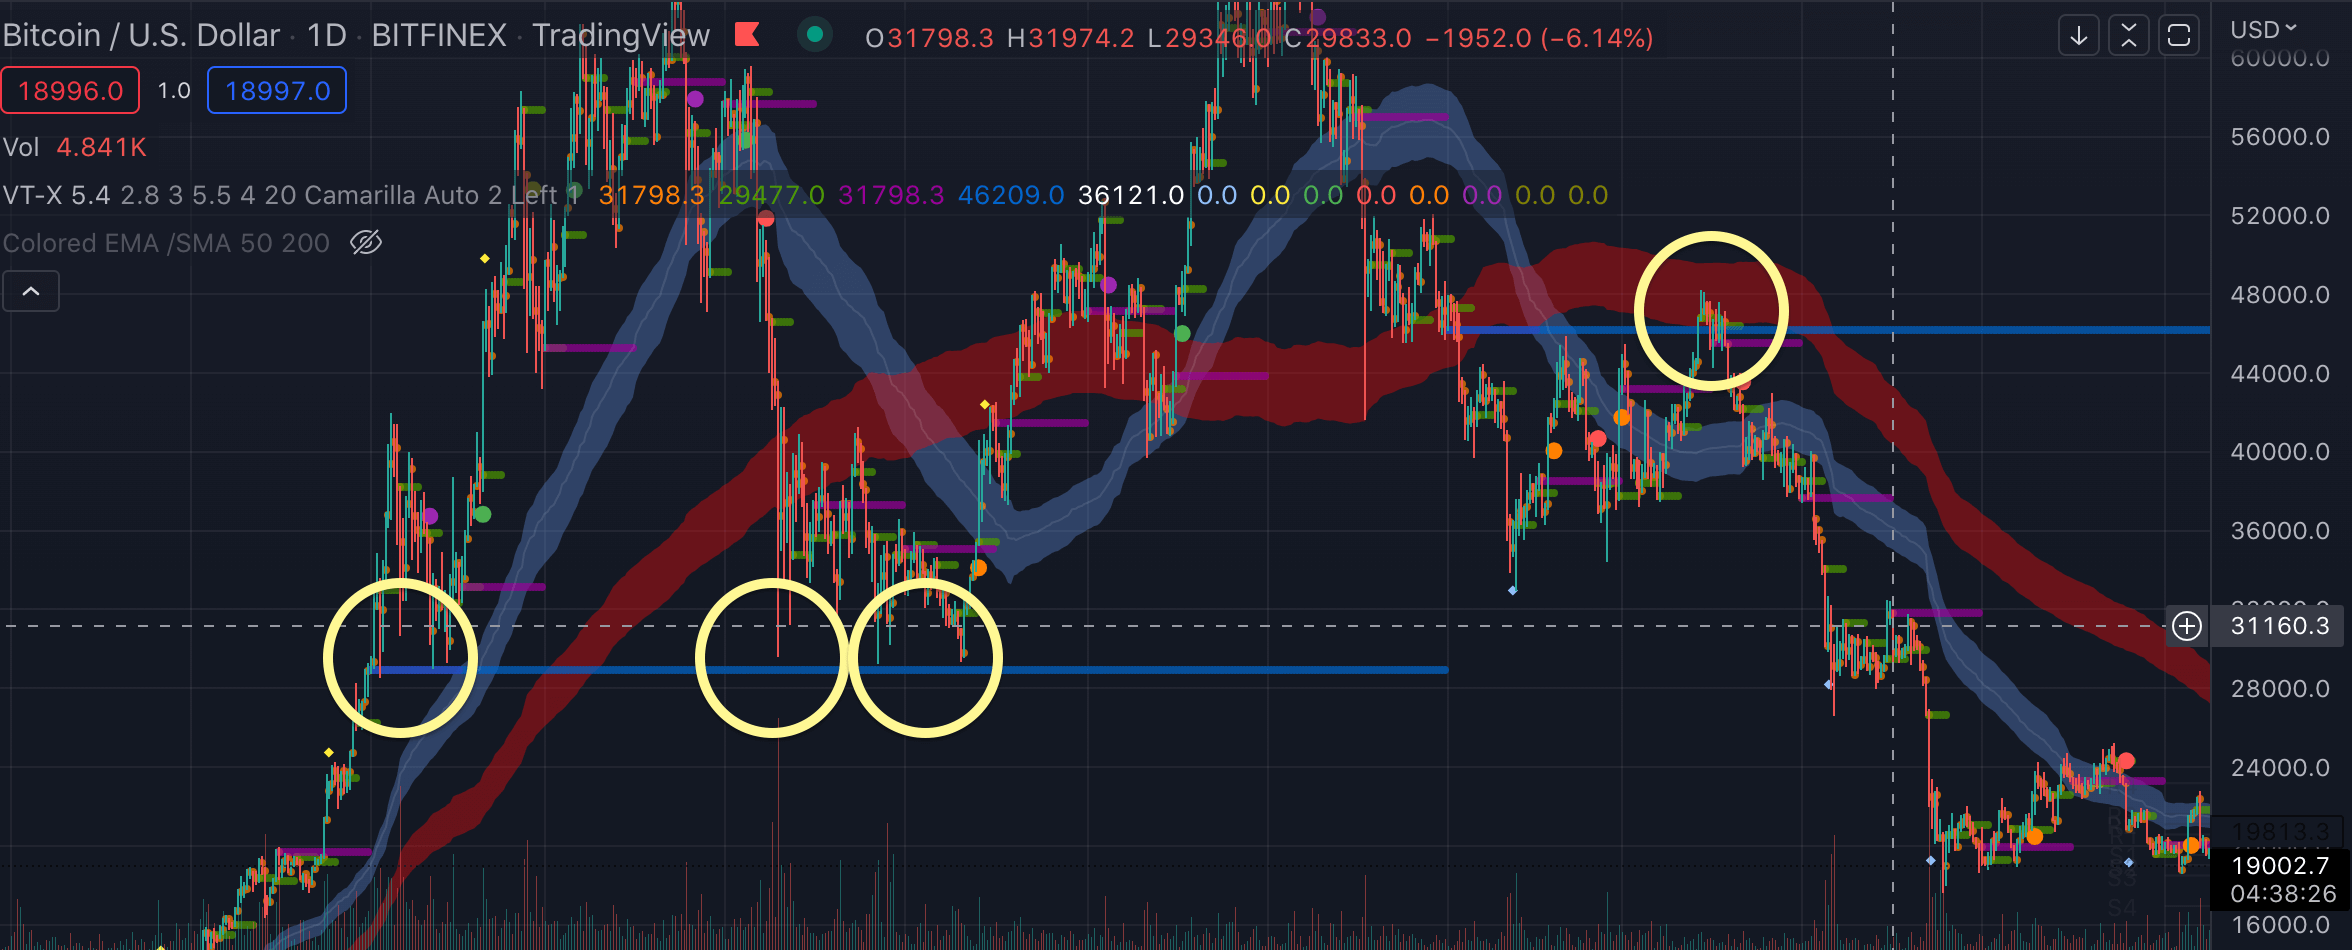
The VTrend bands are volume-weighted, but the crossovers it shows are not far from what you get with 50/200 EMA/SMA crossover. (I used this script from the free library.)
And then, they come with an upper and lower boundary. Premium TradingView scripts don’t usually open the script’s pine code for viewing so I am just guessing here like the rest of you.
The areas of the bands mark the key zones where the market might reverse or stop to make a range, especially when you combine that information with other support and resistance charting tools, or with tools like a volume profile.
On long timeframes like the weekly, the volume-weighted bands give a single glance overview of where the market is at.
That’s all just like an MA, except VTrend paints a range rather than a line. It’s easier to work with visually and can give you a small advantage.
Price-based data for psychological turning points
In addition to volume data, the script paints daily, weekly, monthly and yearly open price into your chart.
On long timeframes, this is a valuable tool because milestone open prices can form a psychological boundary that turns into a support or resistance zone.
The idea behind this is a simplification of the concept of market profile. In market profile theory, you chart a volume profile for each trading day. Then you take a look at what the market does around the level with highest traded volume: Does it bounce away from that level or does it blast through? This says a lot about the market sentiment even when the price changes relatively a little.
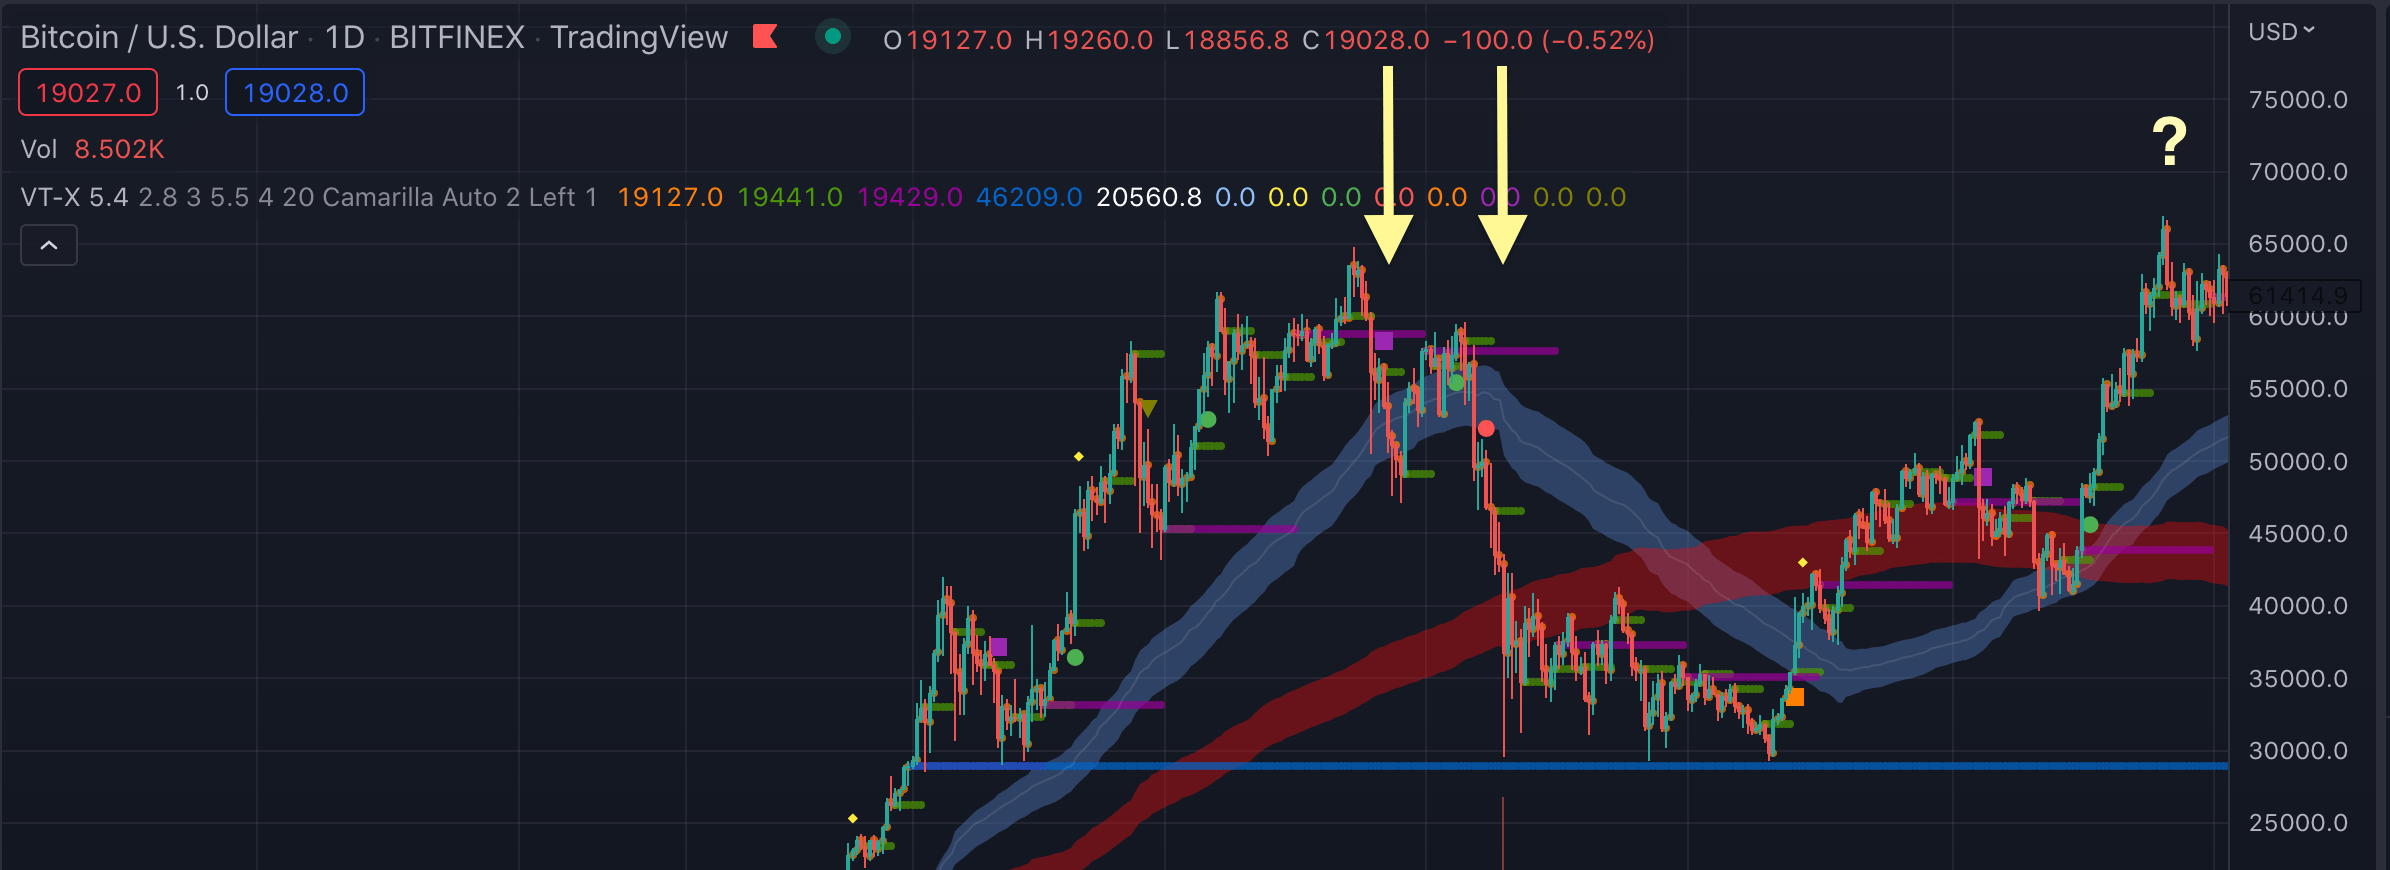
On daily and weekly charts, you can look at monthly and yearly opens in addition to volume data.
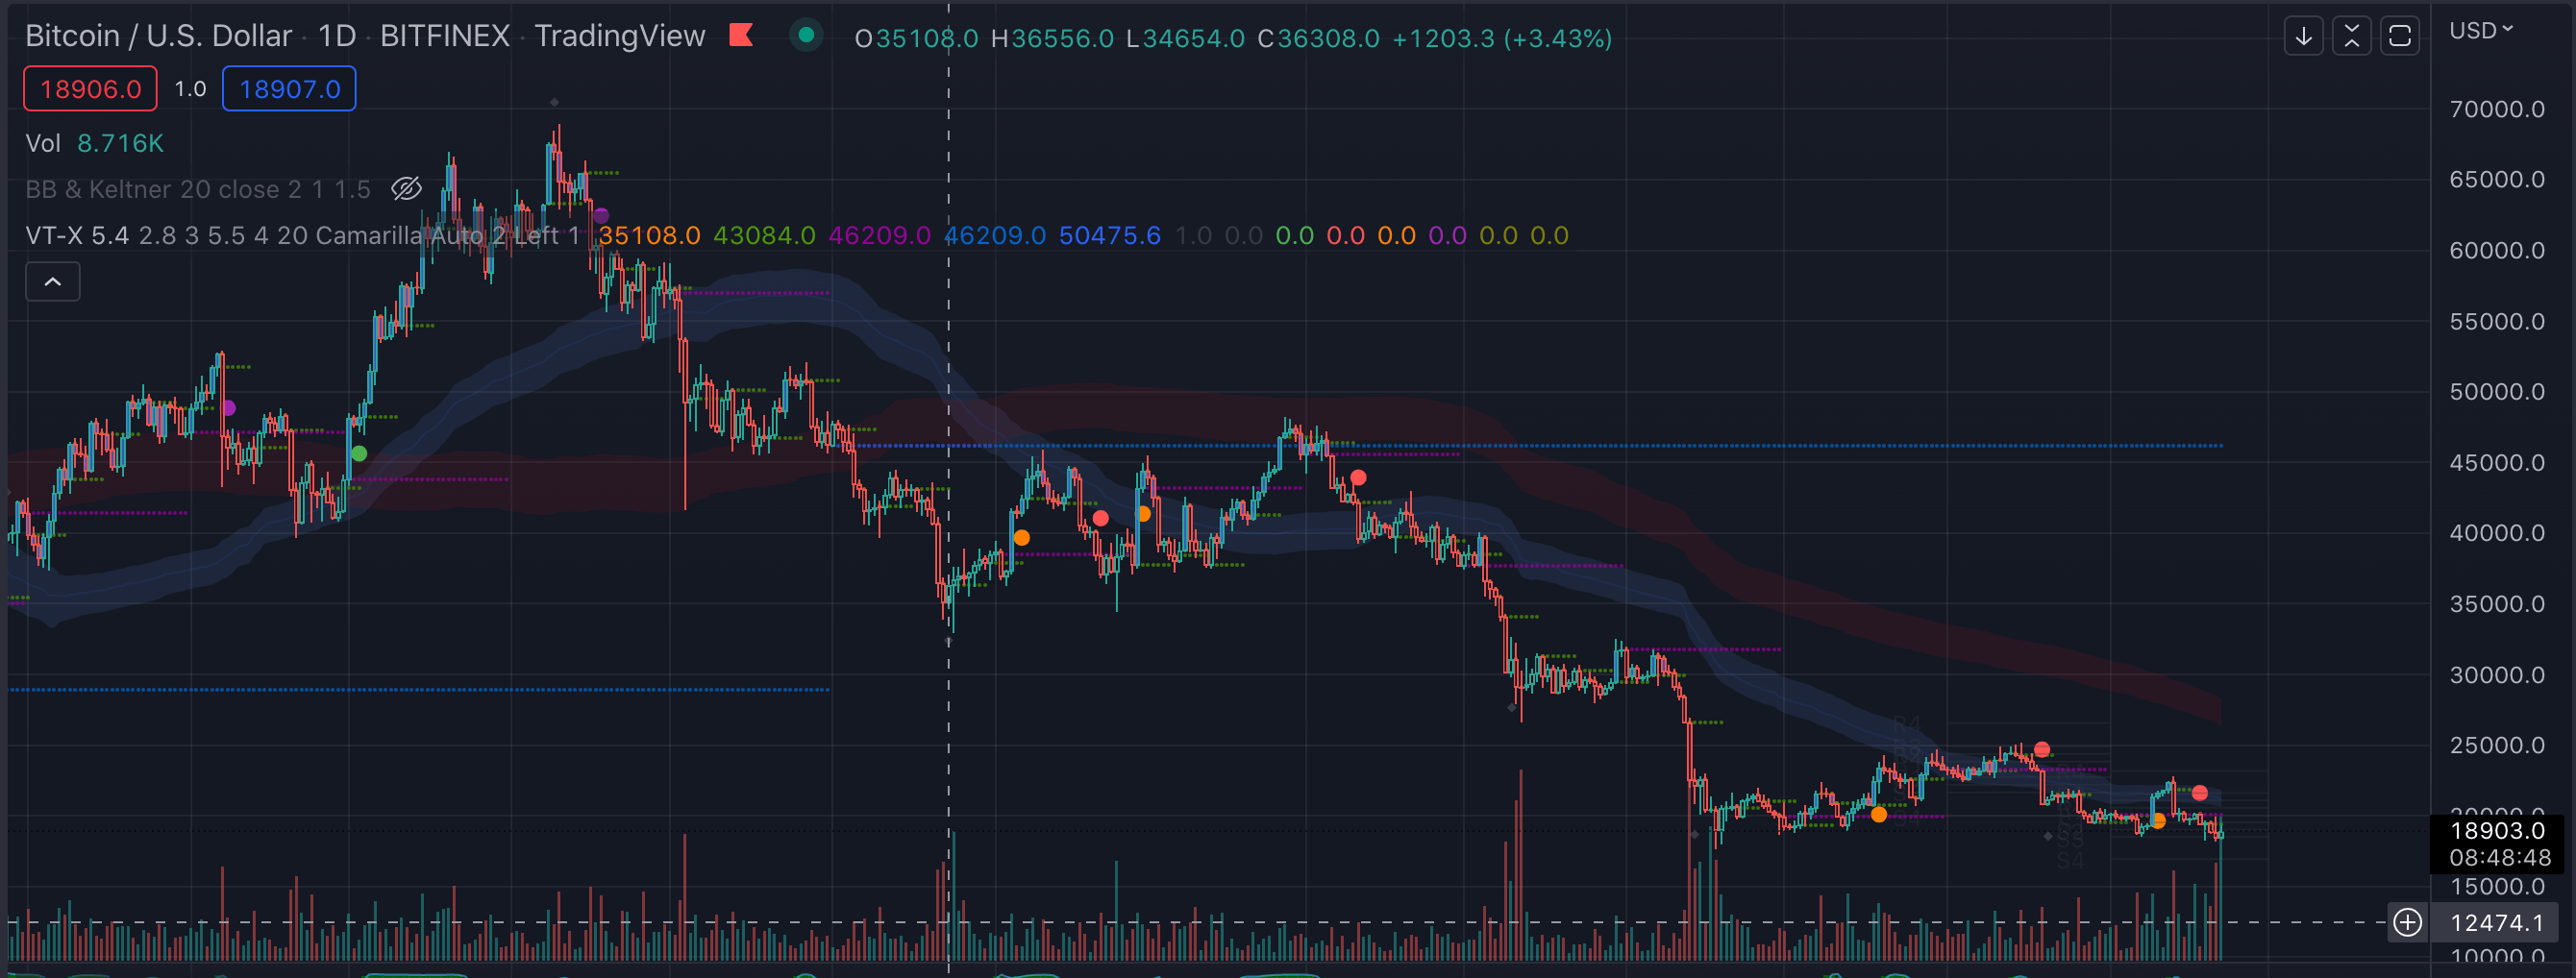
Here’s an example from 2021 and 2022. In 2021, the yearly open of ~29000 USD acted as a support on multiple occasions and eventually, BTC made an all-time-high from there. In 2022 however, the market failed to stay above the yearly open of ~46000 USD.
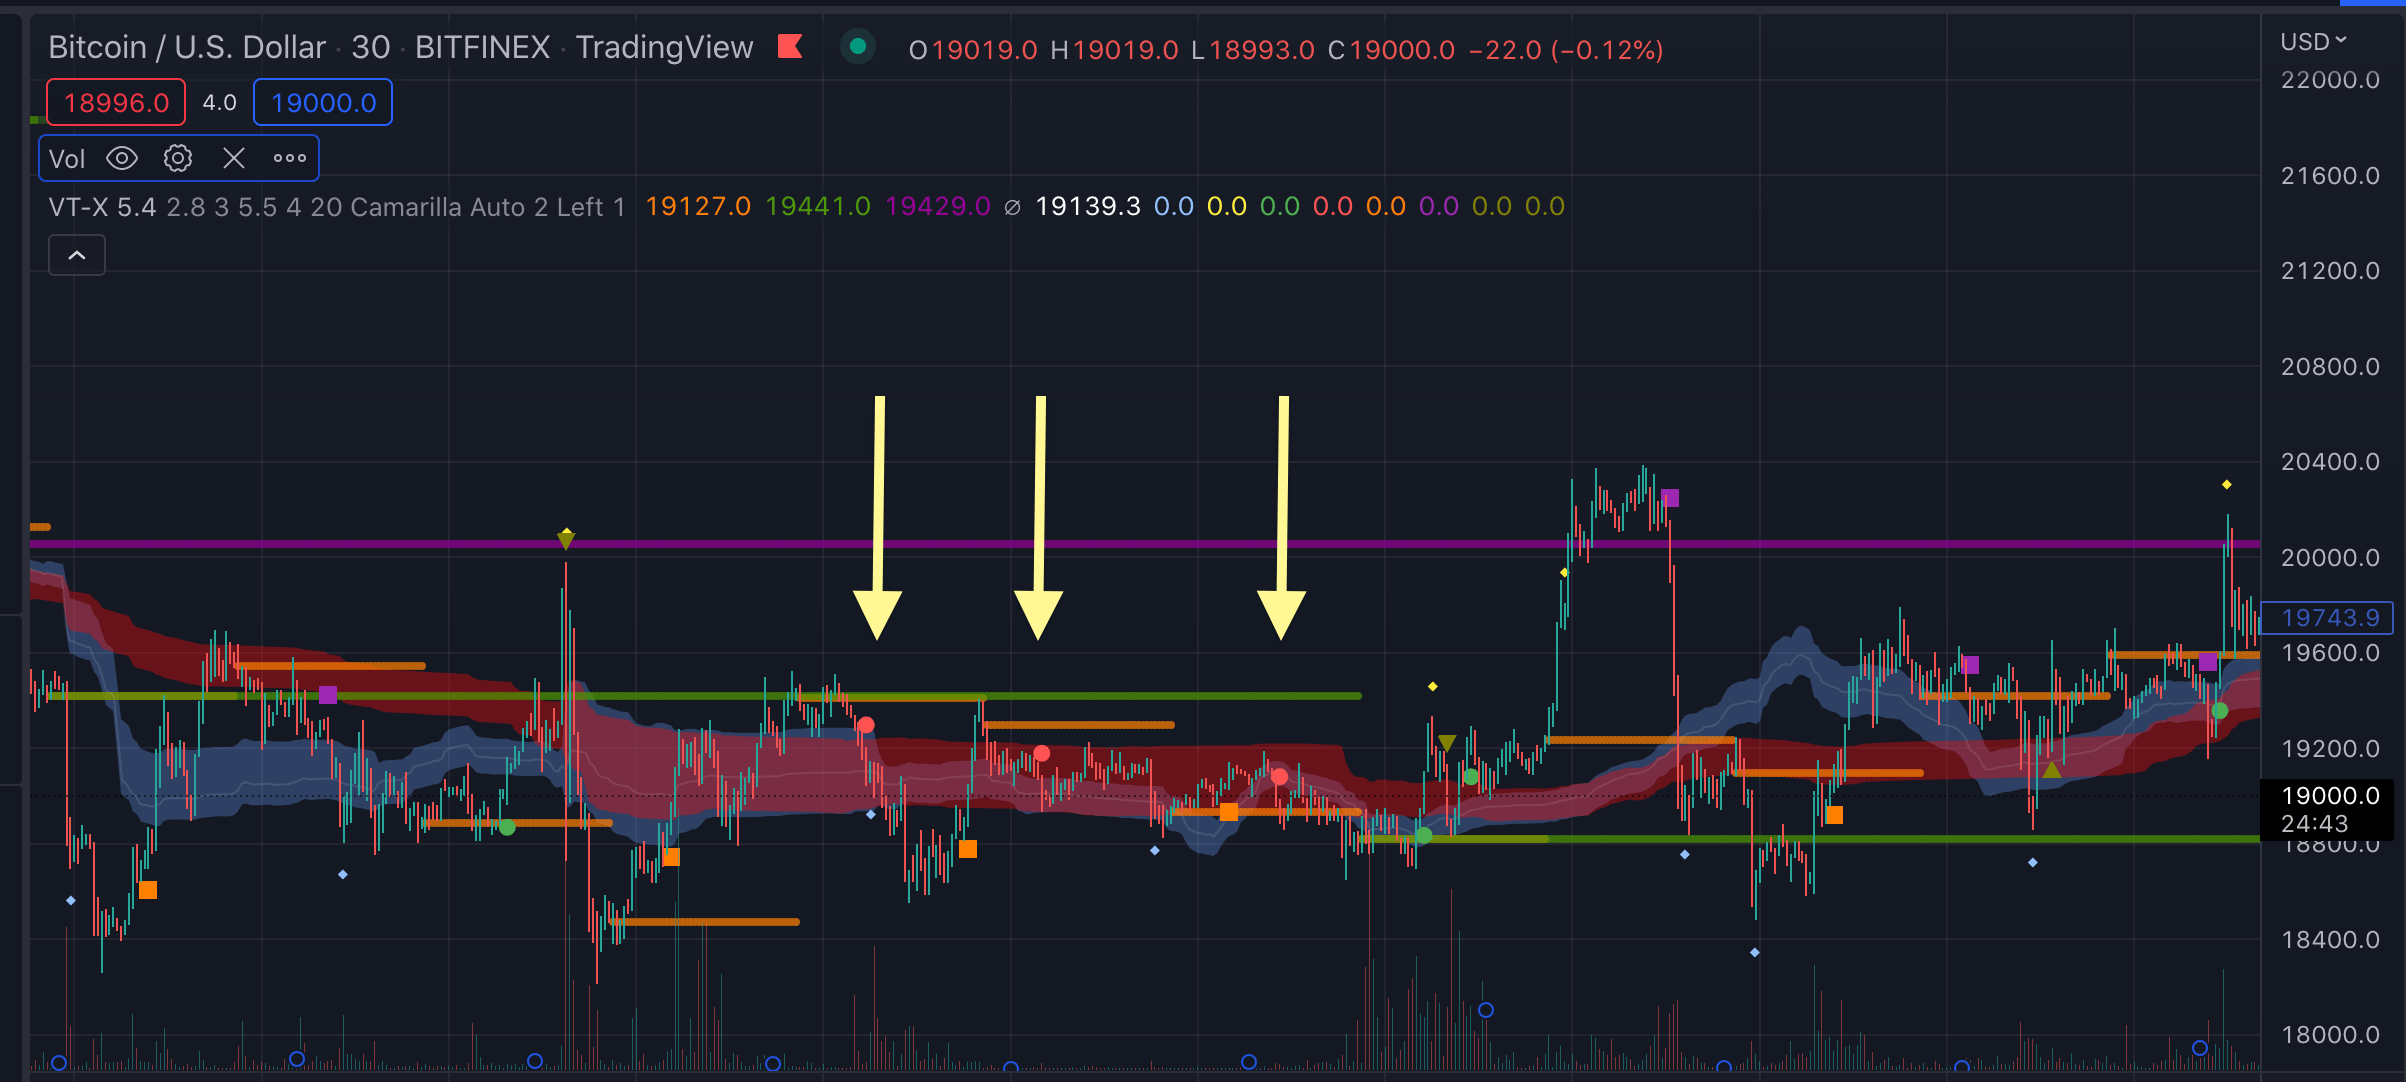
I also looked at shorter time frames, overlaying VTrend on a 30M chart with a daily fix-range volume profile (I used this script from the free library).
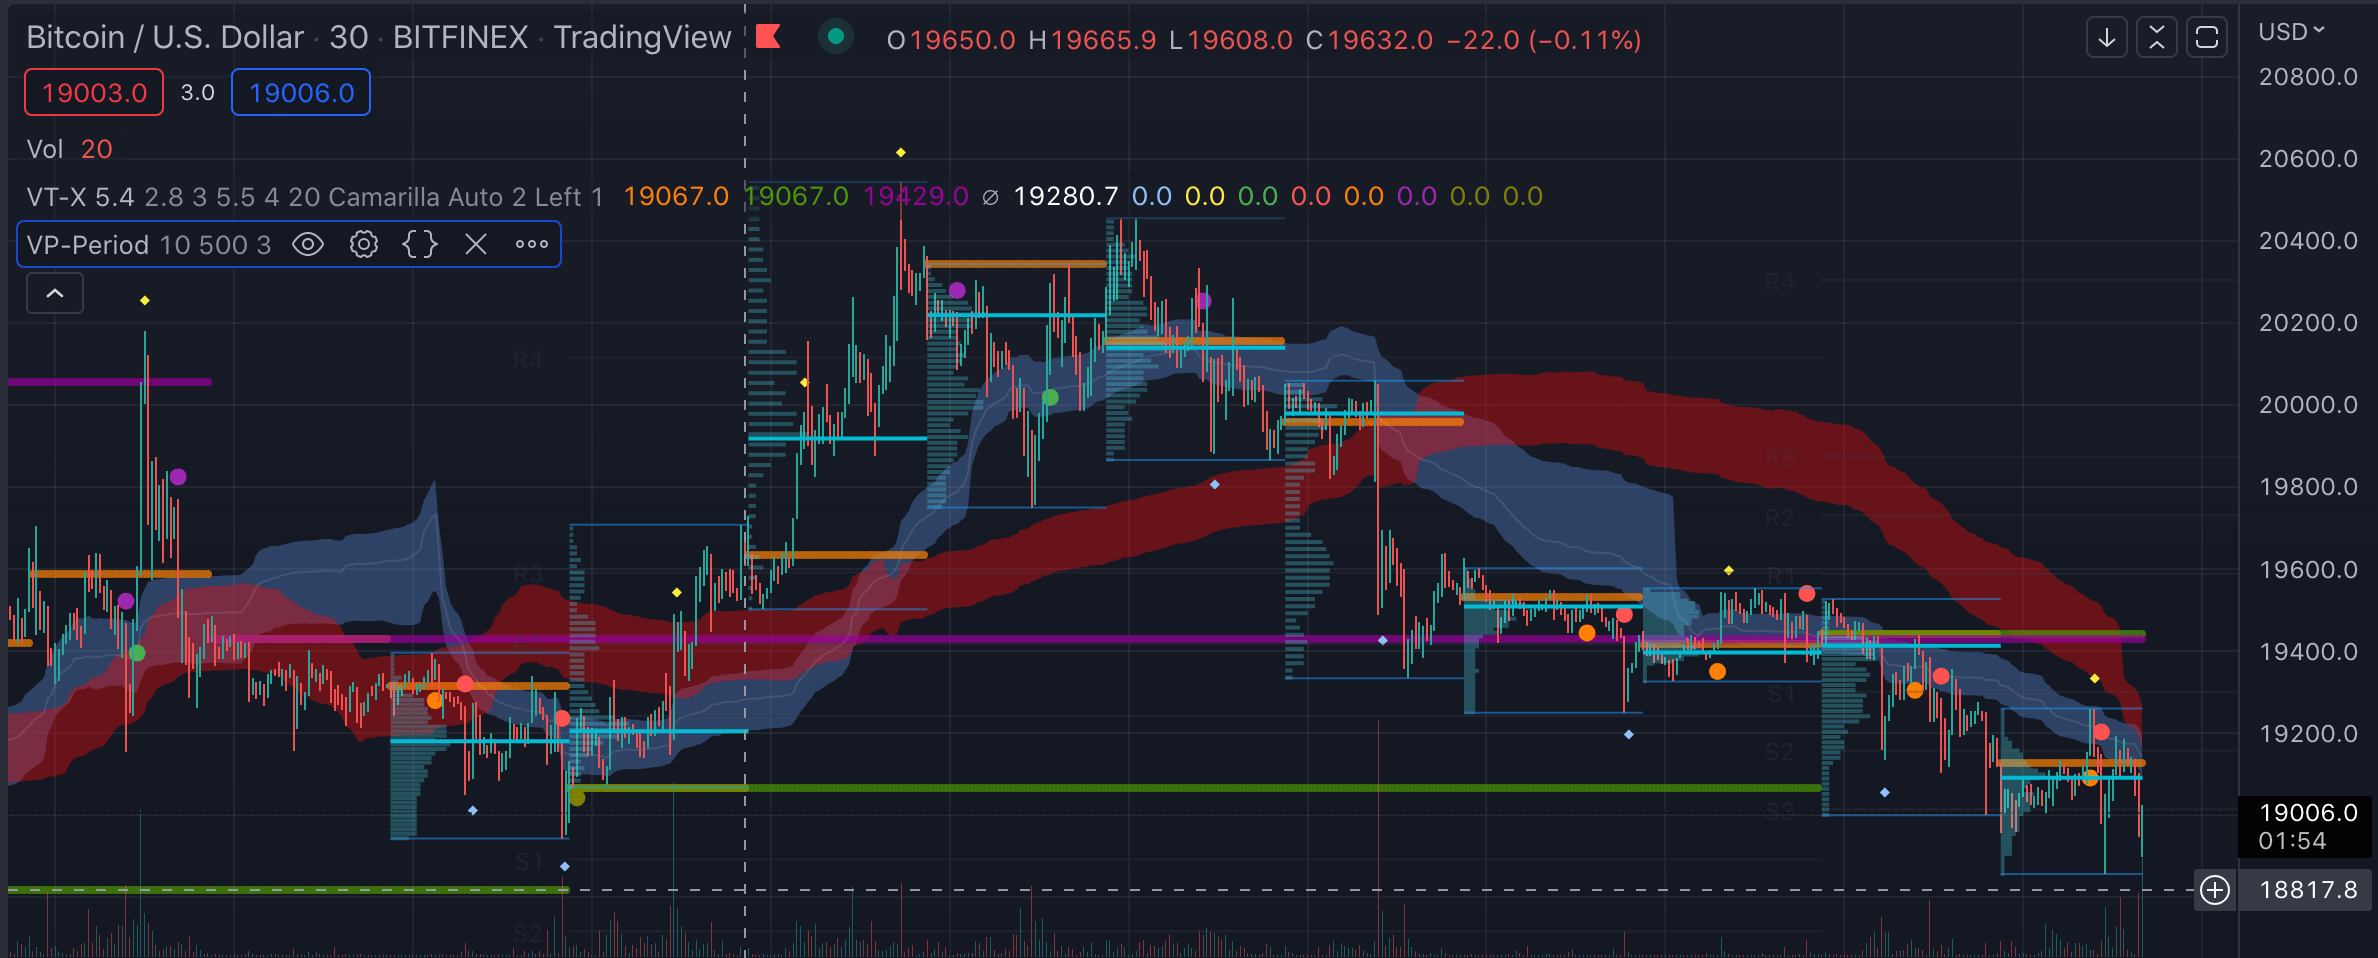
That the daily opens (orange lines) under the market conditions of October 2022 are at about the same level as the daily volume point of control (teal line, the peak of each day’s volume profile).
That shows that the market isn’t trending.
Charting the daily opens together with the volume points of control can be a good addition to your setup for trend analysis.
Trend reversals and the entry signals
The last set of VTrend features are the reversals and the entry points.
They are all black box - you won’t get to see on which logic they are based and there is no way to figure it out, they’re just points on the chart.
You can automate your trading based on them though. Paid TradingView plans support webhooks that can integrate with your trading bot or with a bot platform like Coinrule.
The author of the VTrend strategy backtested a few setups on forex markets, ETHUSD and BTCUSD chart in early 2022.
More backtesting results on vtrendscript.com/#results but generally the trades in the backtest risked 500 USD per trade starting with 5000 USD balance, had a 3% stop and would let the profits run.
In the backtest each trade ran with a trailing stop until it got stopped out either in loss or in profit. That’s a pretty good method. Starting ratio was 1.5 reward to 1 risk.
This setup gave very high PnLs in crypto and much lower in forex, from which I would guess a part of those high profits was letting the winning trades run while crypto was trending.
You will probably not hit such a high PnL in ranging market conditions. Get the free trial and test it yourself, though.
Here’s crypto backtest:
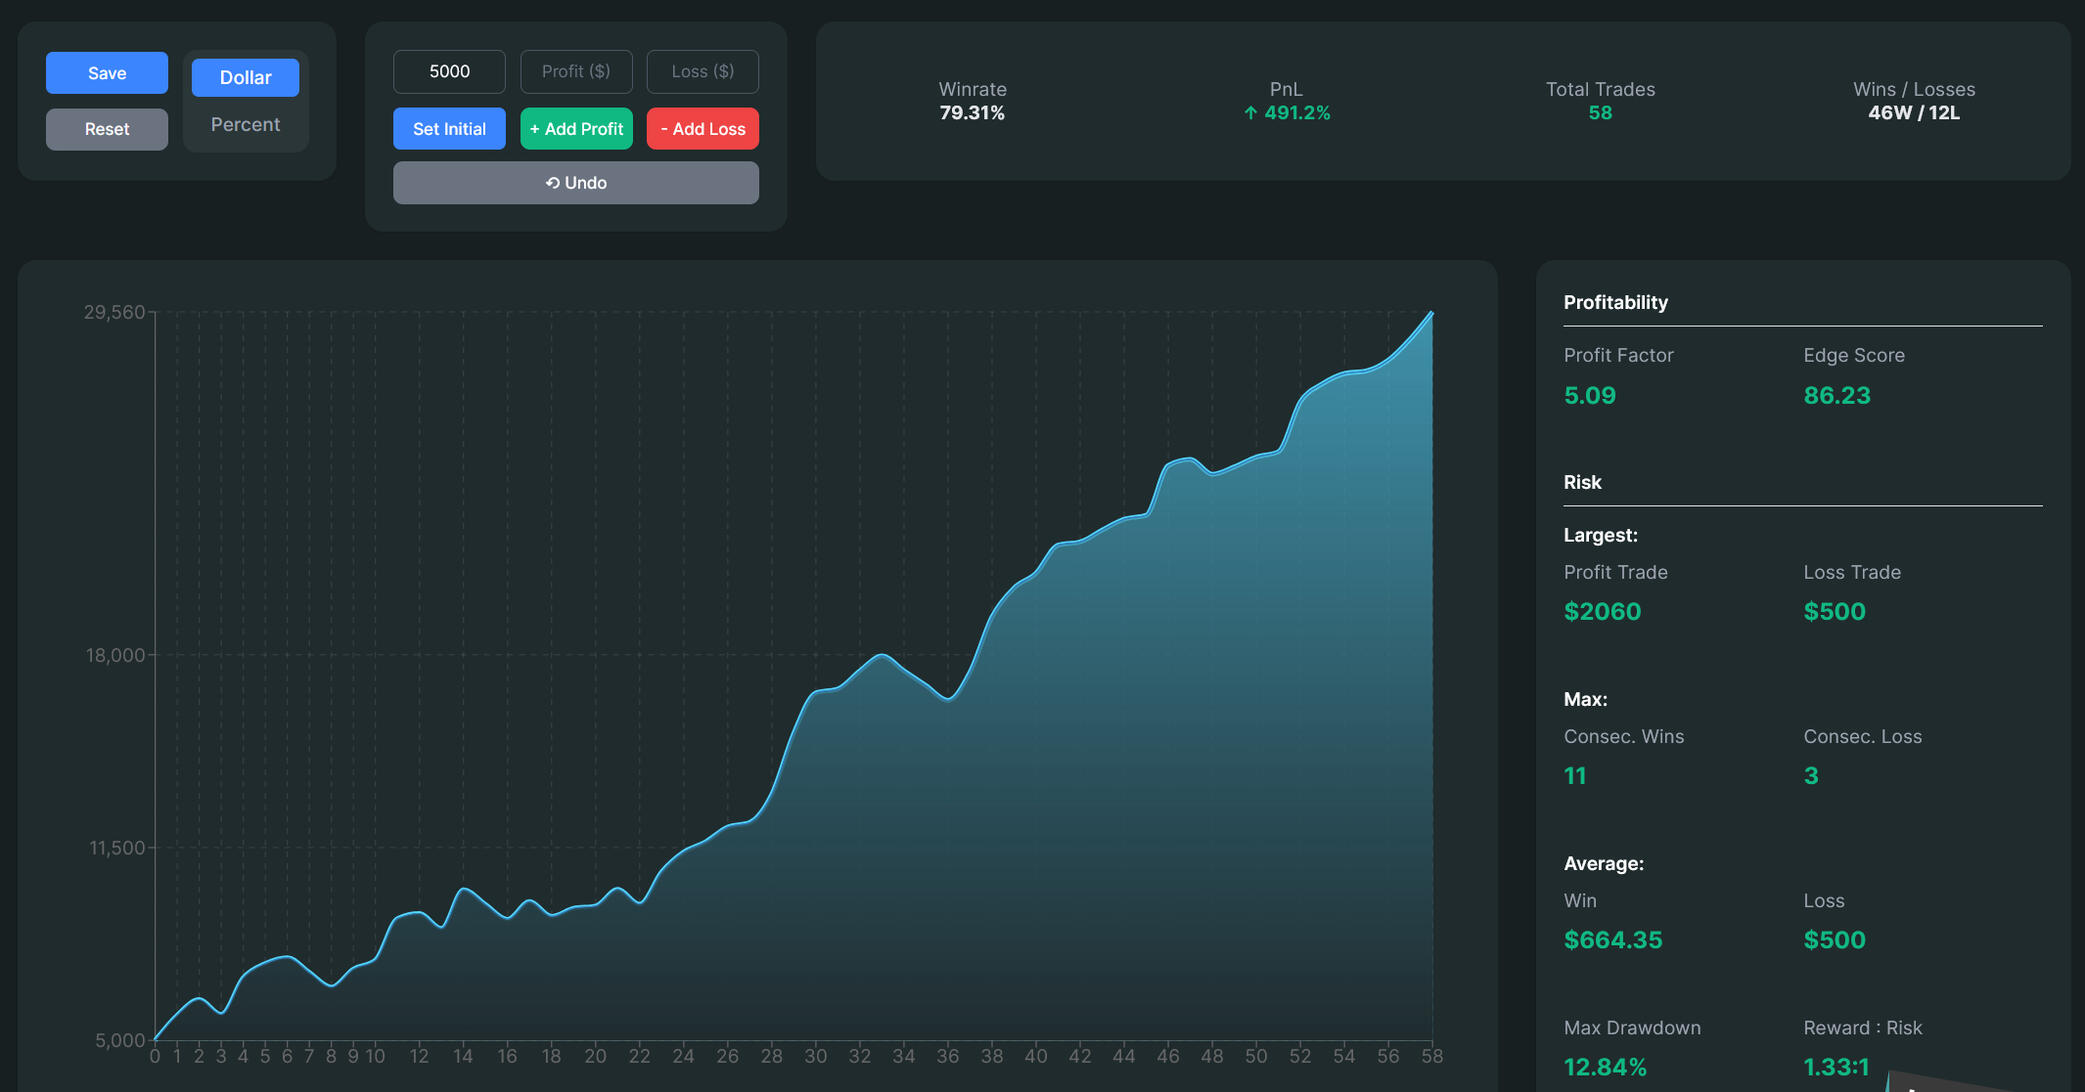
VTrend backtest: BTCUSD on 25m, 58 trades in total, 500 USD out of initial 5000 USD per trade.
And here’s forex:
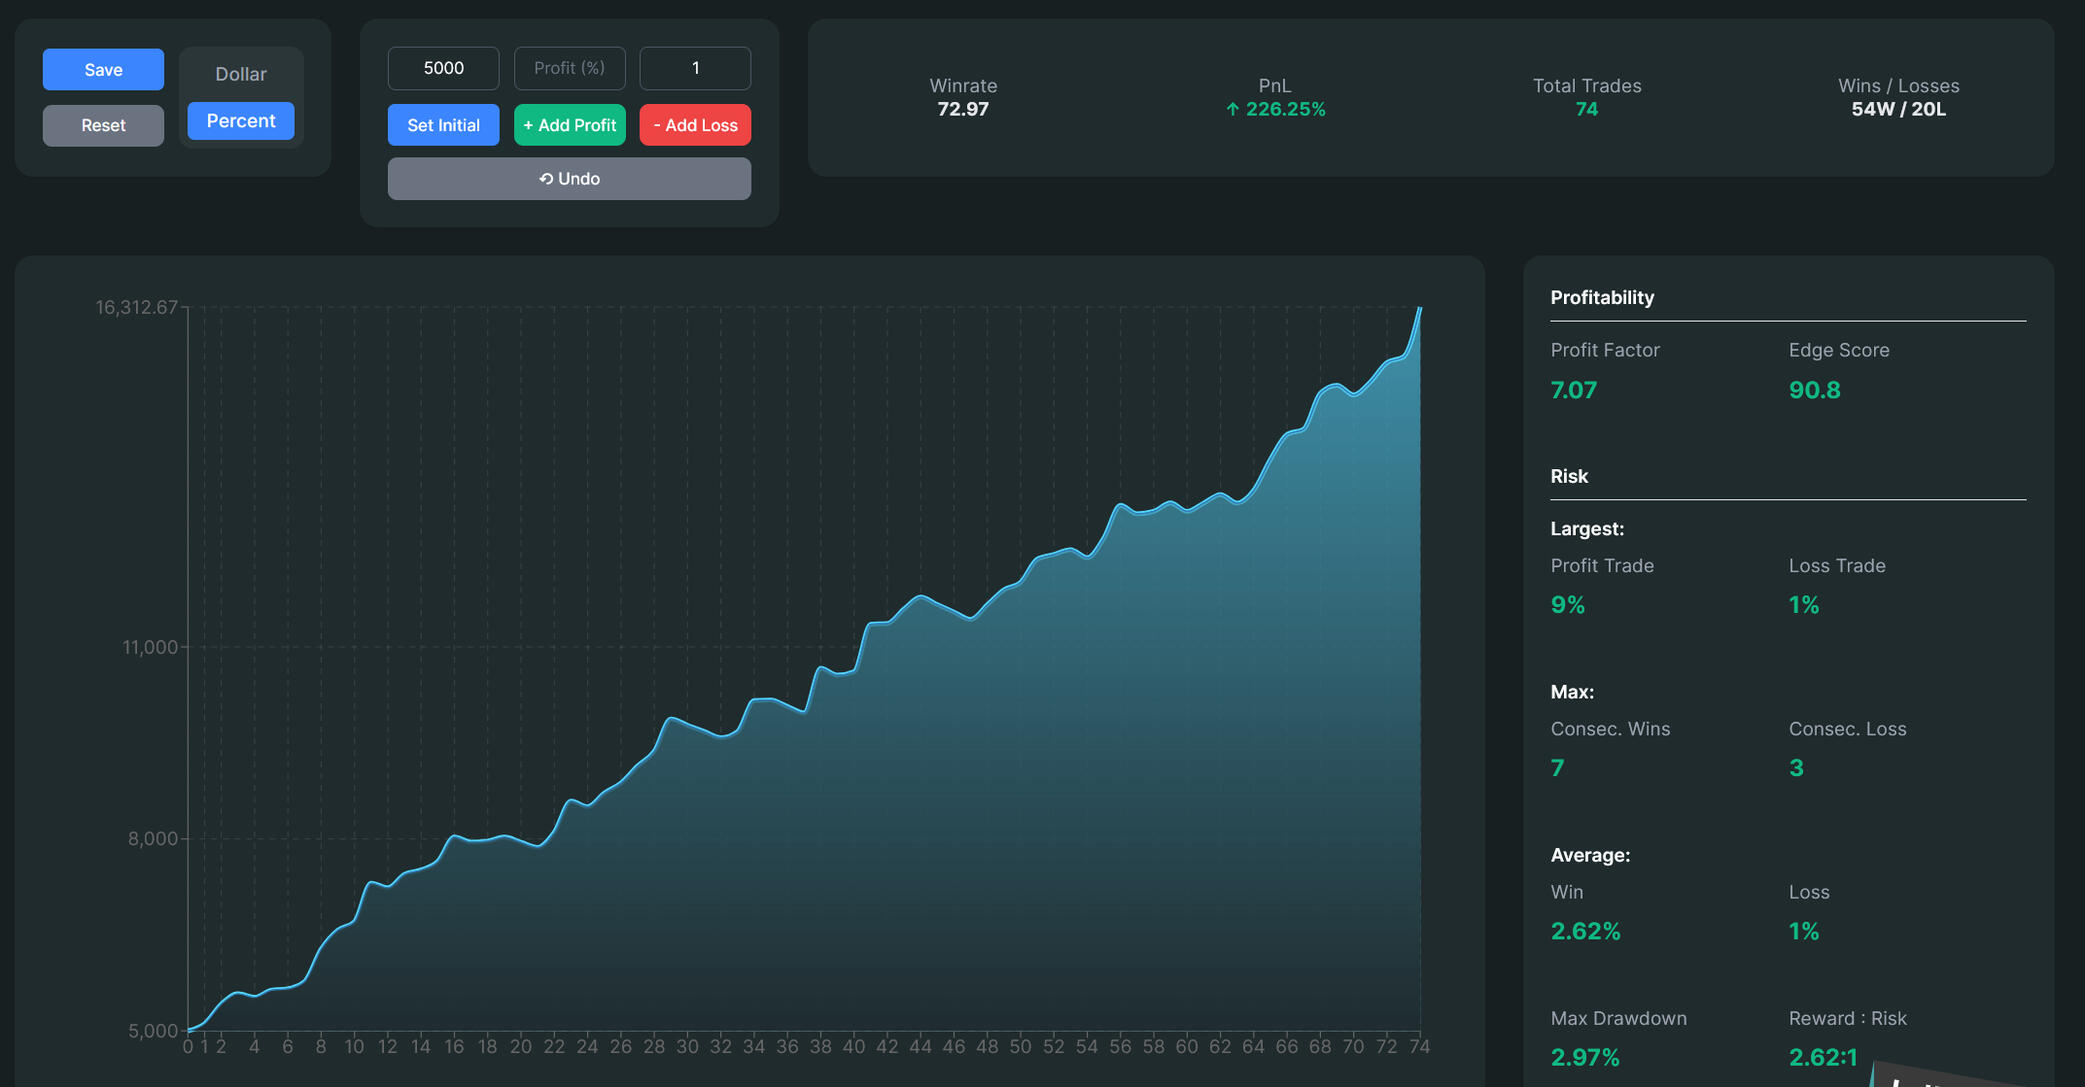
VTrend backtest: USDCAD on 1h, 74 trades in total, 500 USD out of initial 5000 USD per trade.
Trend reversals (Exit signals)
The diamond dots painted in VTrend chart mark trend reversal signals. The author recommends using them as a signal to mark the exit areas. You might still let you trade run but with a tighter stop, for instance.
By looking at the longer time frames, the reversal signals might work with volume. At the 2021 weekly chart, the reversal is signalled at the 45k USD level in early January.
See the yellow diamond there:

That was the early high-volume peak that due to market psychology and greed usually proceeds to run away further up on lower volume.
On shorter timeframes they tend to be more accurate.
Entry signals
The round dots on the chart are entry signals. The different colours separate trades with or against trends and different levels of riskiness. These are the entry signals used in the author’s backtest.
The author says that the script generates the signals based on volume and momentum criteria, but uses additional filters to remove false positives.
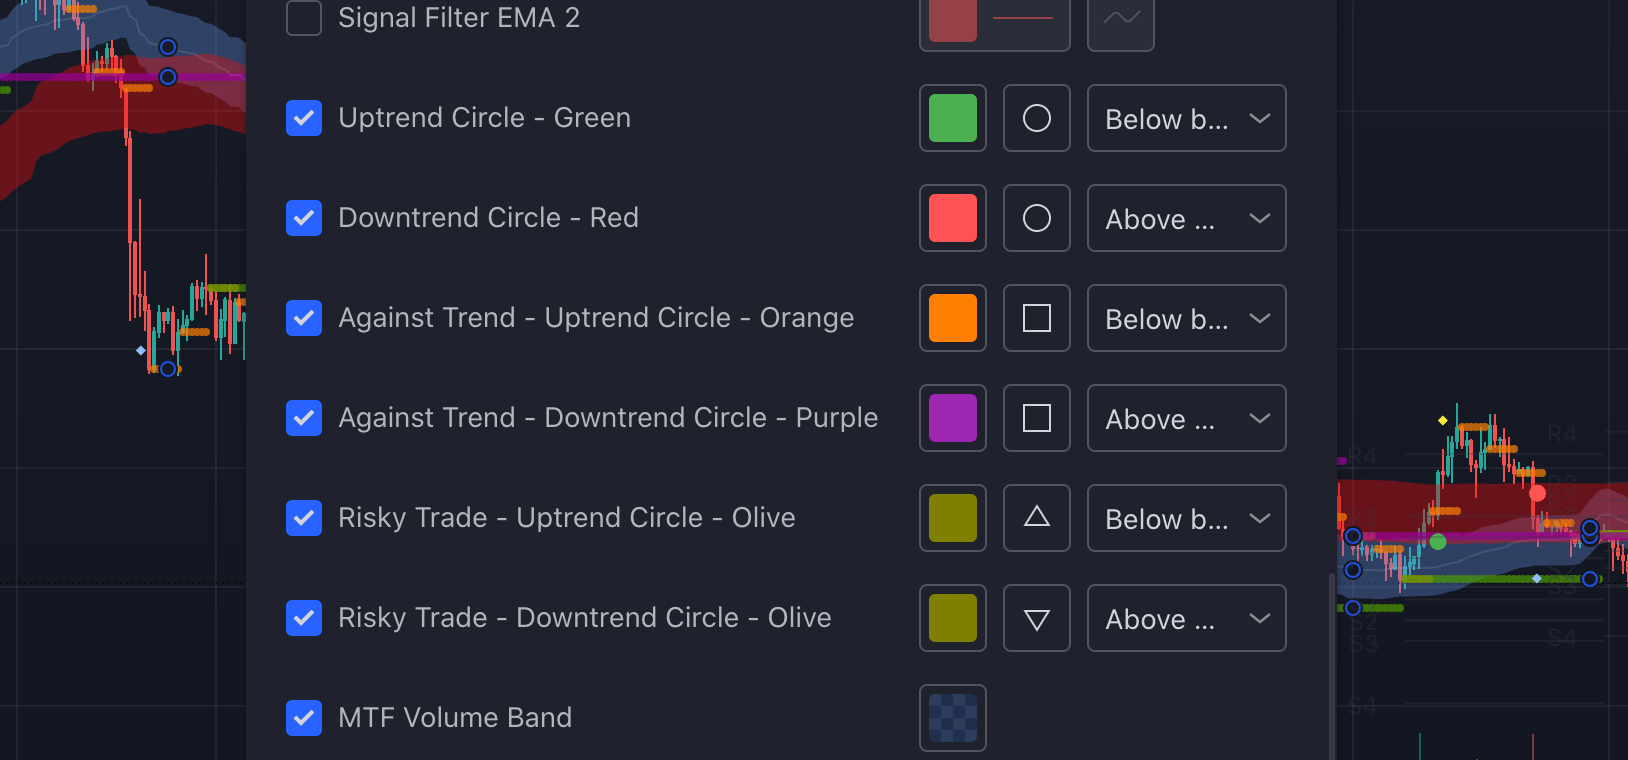
- The red and green circles signal that the price is just about to break downwards or upwards respectively. These signals passed all filters and are less risky to take.
- The purple and orange circles signal a position you’d be taking against the trend.
- The olive circles are risky trades where you’d be taking a position against the trend.
I had to adjust some of these in settings, I didn’t like the default settings where it’s all circles.
I changed the colours of the diamonds because I use a dark chart layout. Then I changed the shapes of the entry signals. There’s a ton of them, they are painted above or below the price action to suggest the direction but changing the shapes still ends up working better for me.
Changing the olive signals to triangles of a respective direction helped me read the chart much easier.
I also changed the signals that are against the trend to squares.
Here’s my settings:
What I thought
I did not run a backtest but following the entry signals, the sell signals are consistently painted quite late: Compare the red dots and the green dots between 30M, 4H and 1D.
This shows that the script will perform better in a bull than in a bear, the short positions will not be entered soon enough.
On the other hand, taking the riskier signals on shorter timeframes with a tight stop might still make good results, as long as you can trade cheap. It will make you trade a lot of chop so you need cheap trading to make small wins still profitable after fees.
As for charting and manual trading, I liked it a lot. I think the VTrend script makes reading the chart easier and saves time on that if you like working with indicators that have roughly the format of the Ichimoku cloud.
VTrend is based on different market metrics, has vastly more functions and gives more and clearer signals; however, it still has the single-glance look of Ichimoku. I got used to working with it pretty fast.
Volume-aware traders who have the eye for it and trade occasionally enough to not be burnt out from staring at charts would have mostly spotted these signals without the script as well.
But that’s the thing, VTrend has that all done for you and painted on the chart.
The cost is 420 USD per year, or 50 USD monthly, and it’s a single script. TradingView’s FREE plan that caps you at 3 indicators per chart.
- Get VTrend here
- Get a TradingView Free account