
TradingView is an invaluable tool for us traders, and that even in its free-forever version.
Here’s a quick guide on how to set up your TradingView chart so that it shows multiple markets in the same window.
If you’re not aware of the multichart feature and you’re not sure why you’d want to use it, you’ll learn that at the end of the article.
The multichart setup is available for every TradingView user, even those on a free plan.
How to set up Tradingview to show multiple charts
-
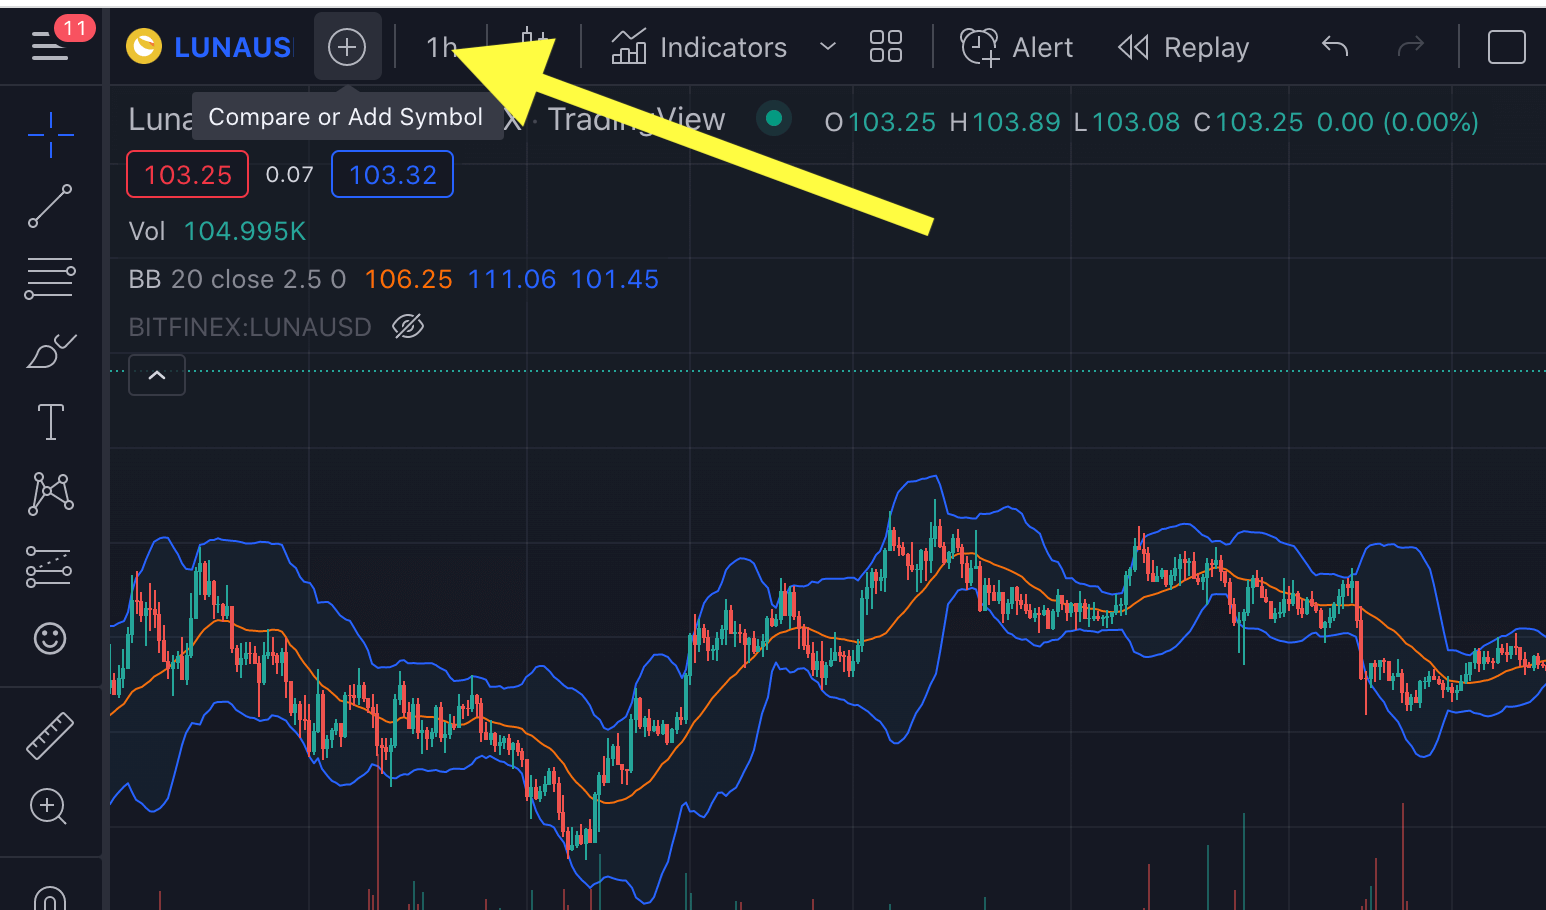
Click the ‘+’ icon in top left corner
Load a chart layout with the main market - usually the main market of your trading focus.
Next to the market ticker in the top left corner, there’s a ‘+’ icon. Click it.
-
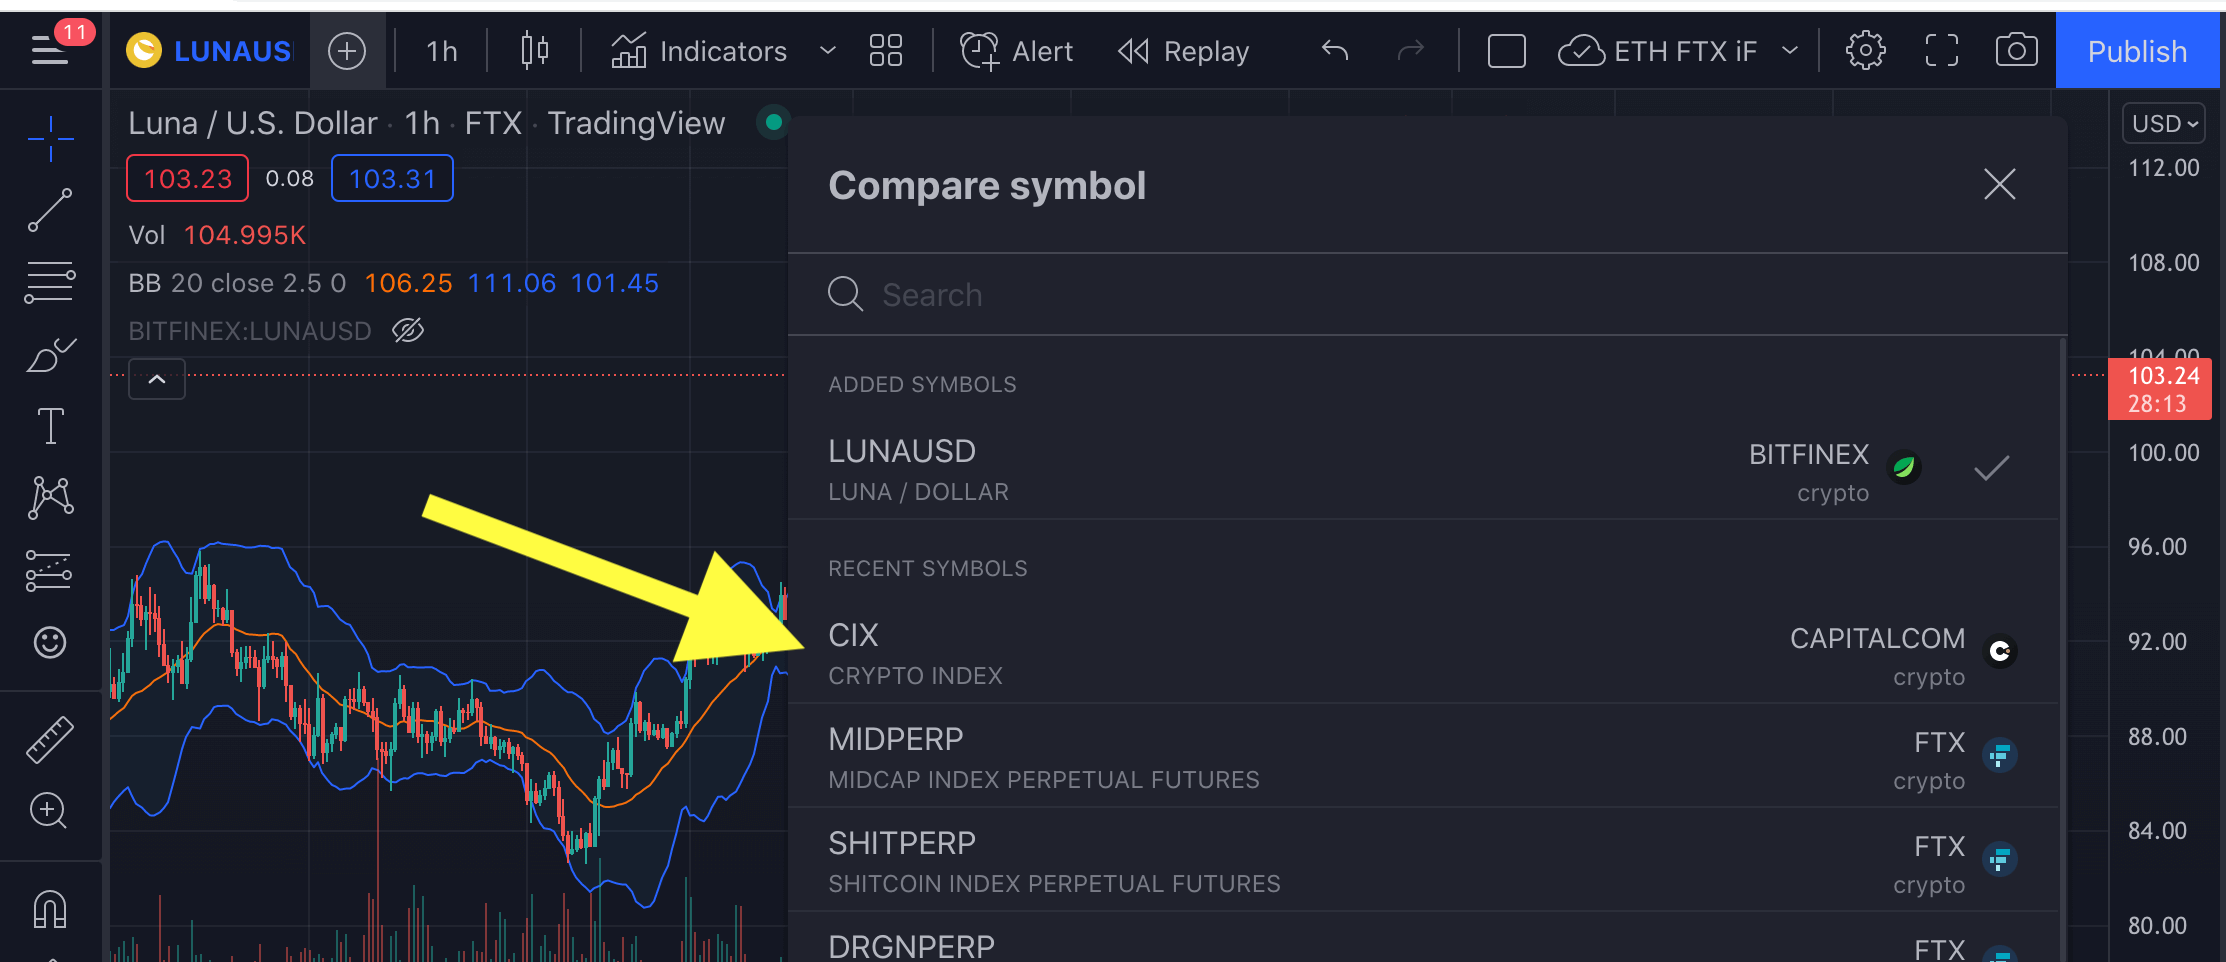
Search the ticker you want to add
The ‘+’ icon opens a dialog where you can search all markets available on TradingView.
Find the ticker you want to add and point the cursor on it: I am choosing the CIX ticker, which is the Crypto 100 Index.
-
Select ‘new pane’
When you hover your cursor over a ticker, 3 buttons show up for you to choose in which way to add that market.
Click on ‘new pane’.

-
You now have a line chart in a new pane
This is what it will look like by default:

You can resize your panes as you like by dragging the edges.
-
Optional: Change to a candlesticks chart
To change to the candlesticks chart, to which you are probably used to, click the cog icon:
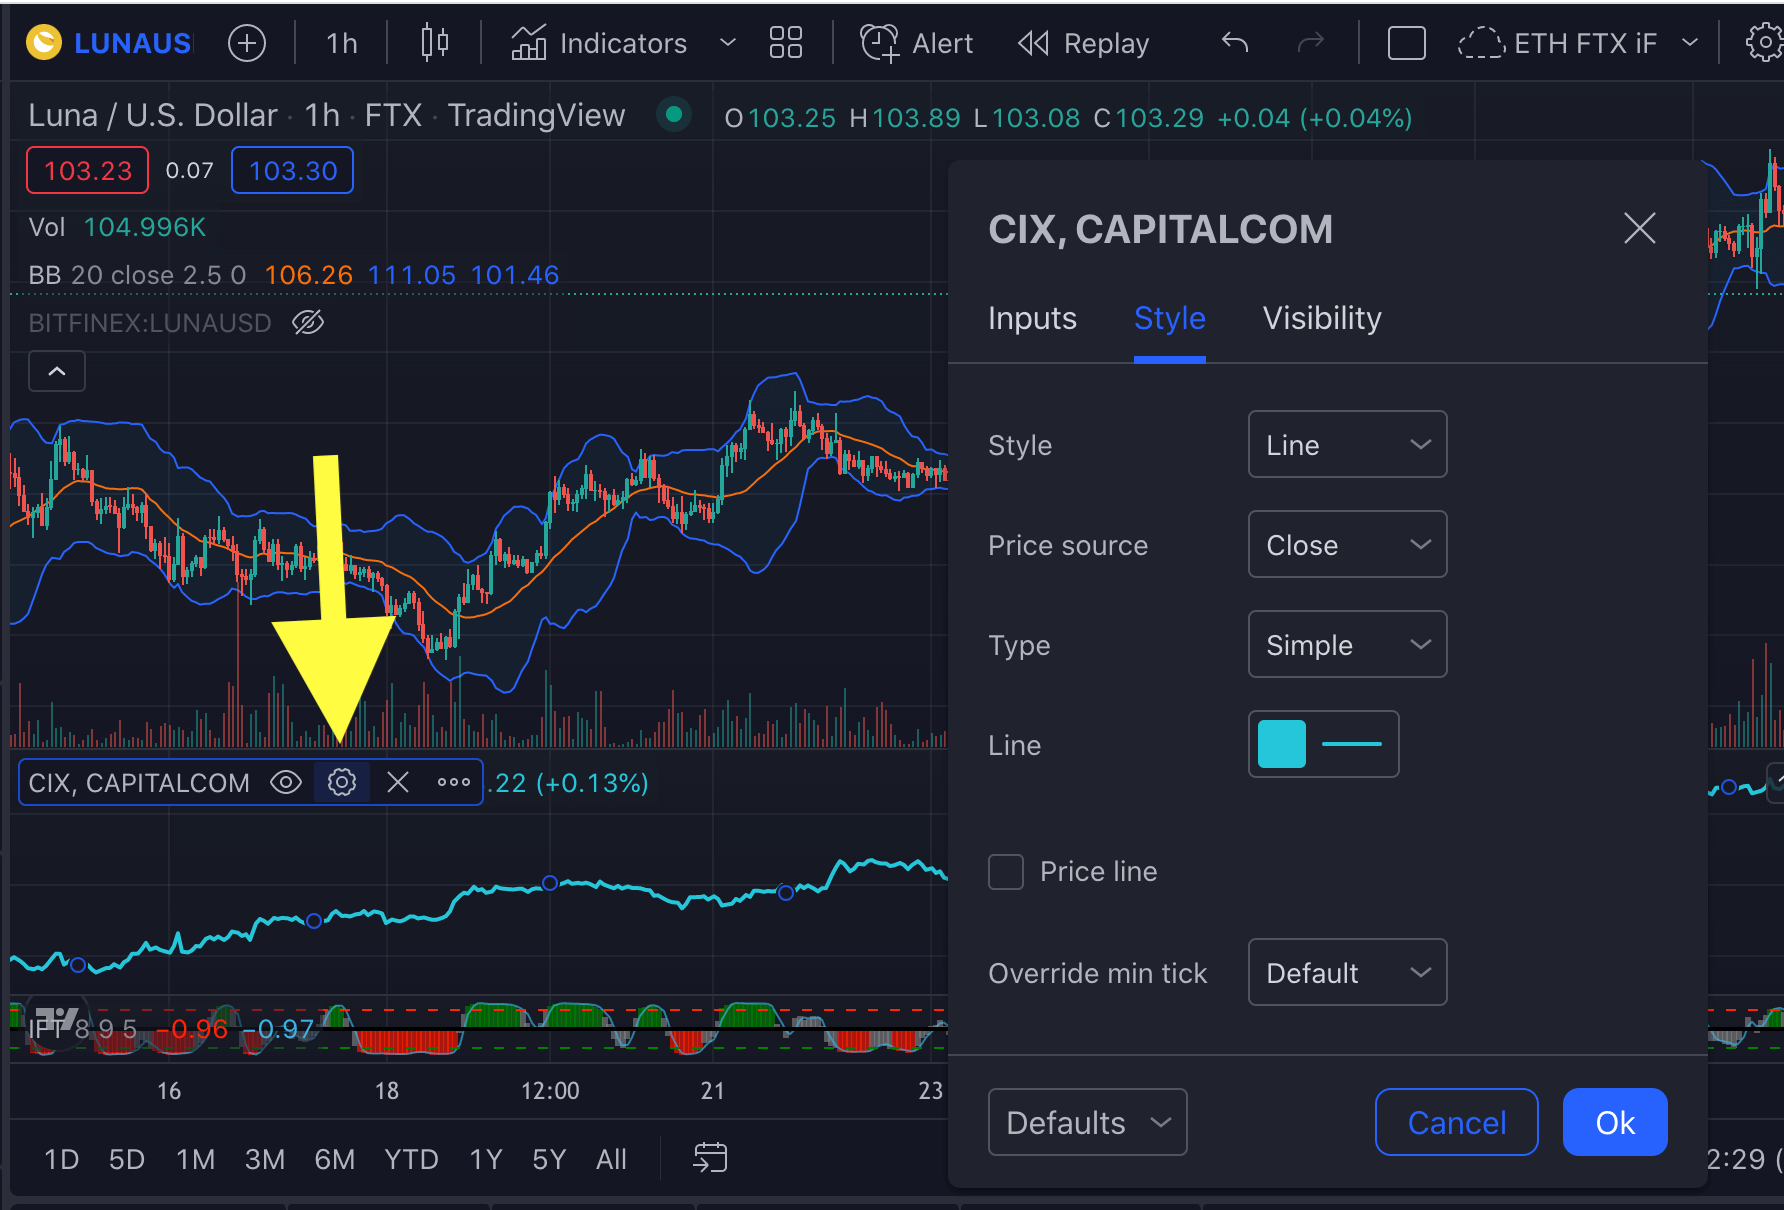
Change the setting from ‘Line’ to ‘Candlesticks’:

-
Optional: Add technical indicators, scripts and strategies
Your newly added chart pane has access to the same TradingView script library as all TradingView charts.
Click the three dots (obscured in the picture) and select ‘Add indicator’ to access the library of technical indicators.

If you’re uninspired and don’t know what indicator to add, pick something from the free scripts we reviewed in ScriptSpotlight.
-
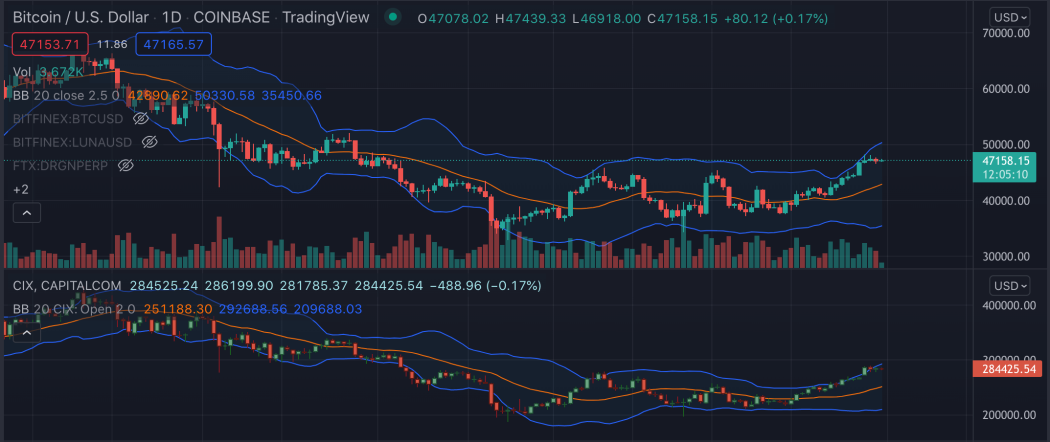
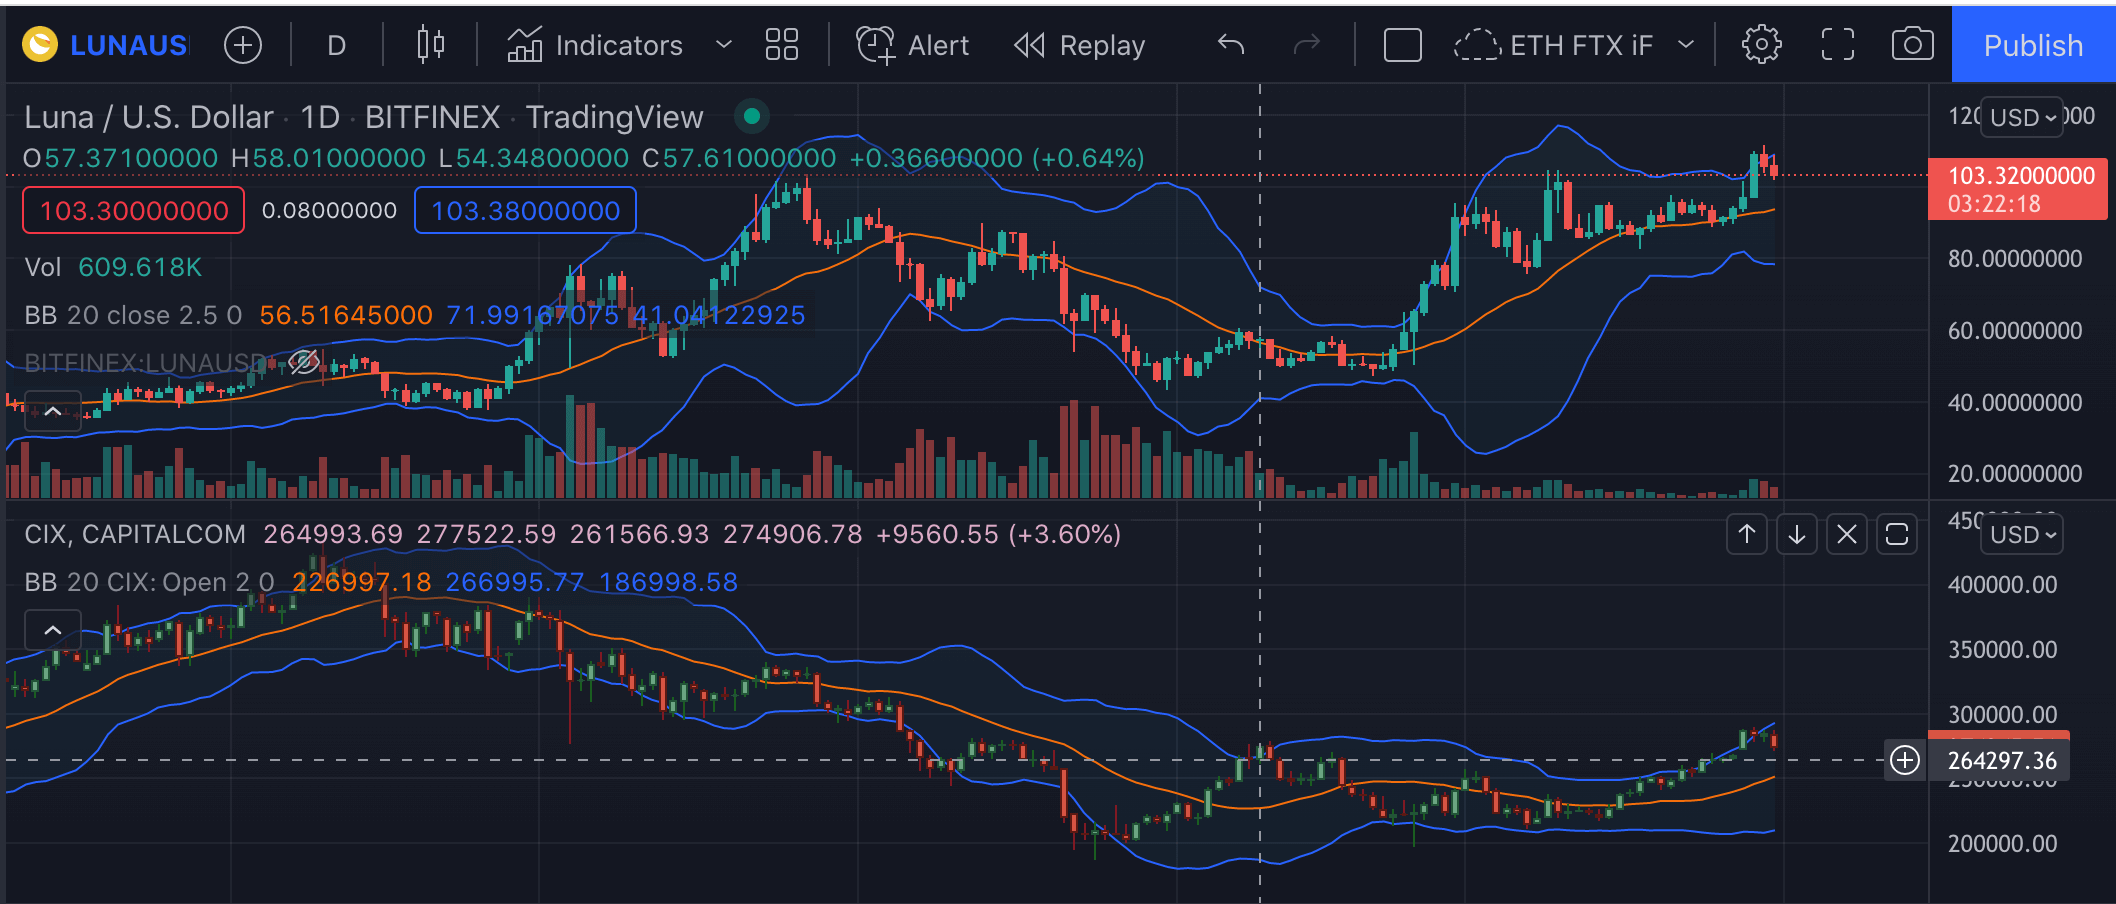
Final Setup: A Tradingview window with multiple charts
Make a free account at TradingView to try it out and maybe do some good market timing analysis.
What to use TradingView multi chart layout for
Having multiple charts stacked on top of each other is the best way to set up for market timing analysis.
In market timing, we compare the performance of a single market with the performance of the industry represented by a basket index.
So, in crypto, you’d have to compare for instance ETHUSD with some USD-based basket of cryptocurrencies. There are a few of these indexes around - CCI30 is a good one, but not very easily available.
Sticking with TradingView, you’ll get a decent choice of indexes right on the platform:
- CIX (CRYPTOINDEX 100), which is the top 100 crypto coins, continuously rebalanced.
- Here is the TradingView chart of CIX.
- Index methodology can be found at cix100.com.
- FTX index perps of various altcoin groups:
- The Dragon index for Asian cryptos
- An index for mid-cap cryptos, which are basically dino alts
- An index for small low-cap cryptos
- An index for exchange tokens like BNB, and so on.
- Composition of FTX indexes is in their docs and the code for 5% fee off is
altcointrading.
The best choice of index for market timing purposes is the CIX.
It’s the largest basket and TradingView has it available as plain index, not as a perpetual swap of an index.
The basic market timing is done just by visual comparison of the two candlesticks charts on top of each other. Tradingview automatically aligns them candle by candle on the same timeframe, which is handy.
Here is what it looks like with the CIX index:
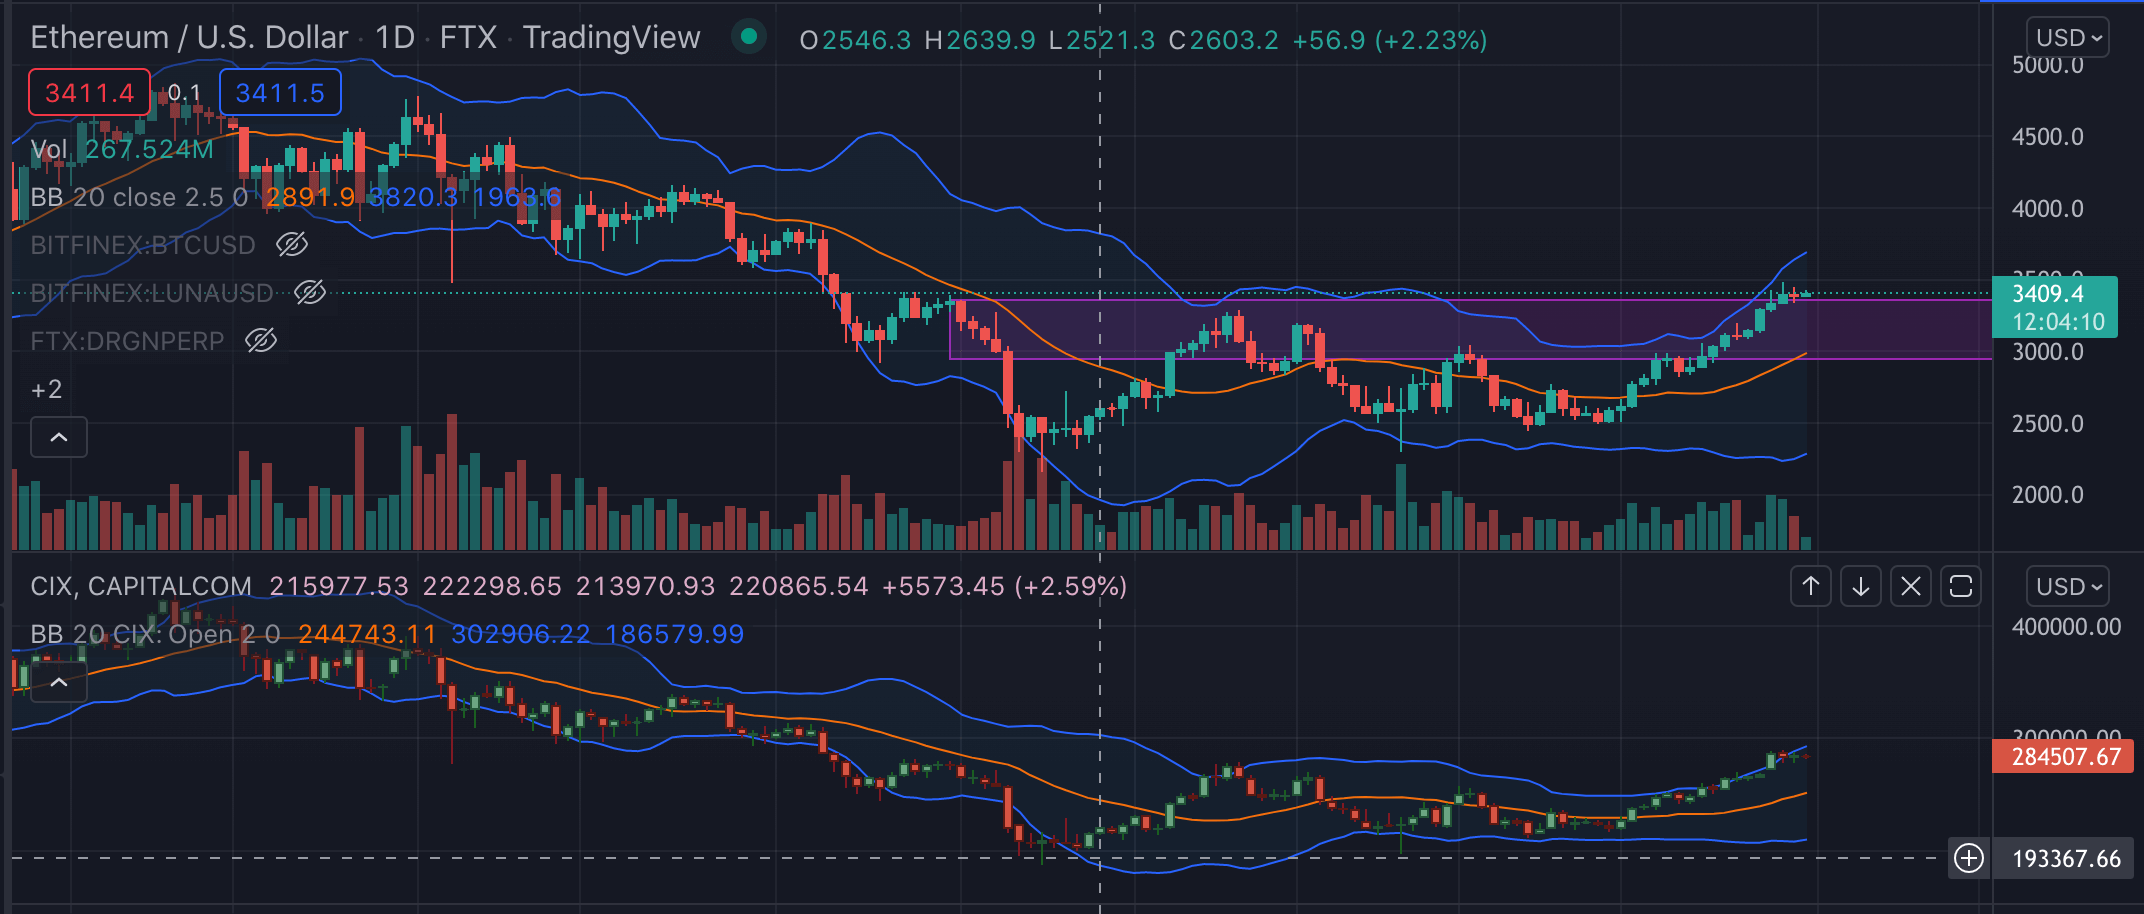
- The index represents the price action of the industry as a whole.
- The single market chart shows whether your market has stronger or weaker runs than the industry in general.
- To make the visual comparison easier, you can draw support and resistance or high volume areas into both charts. Then see if both the market and the industry index crossed them.
- You can also use indicators that overlay price action on both charts.
- Bollinger bands will help you judge which chart declined relatively lower in its bottoms, or peaked relatively higher: It’s about the distance of the extreme from the band.
- Fib retracements can also help judge the strength of the market vs industry: In retracements, the stronger market will bounce sooner.
Finally, I will not miss the opportunity to note that in Wyckoff speak, to see if a single market moves stronger or weaker than an index is to say whether it is a leader or a laggard.
There are certain benefits in trading or at least following the leaders, such as that they often top out first.
- If you want read more on market timing, we’ve got a strategy post on that.