
A/D Levels by ParCorn on TradingView

The A/D here stands for accumulation and distribution, but this particular indicator does not analyze trend at all.
It is simply looking for reversal candles on your timeframe. Once it finds a reversal candle, it draws a support line from its price level.
The Script Breakdown
The script defines parameters for the candle - the size of the candle body and candle wick.
It then runs through the chart and finds the instances of candles with “bullish wick” and “bearish wick” which is the short-term reversal signal.
The size of the wick and candle body is relative to the true range.
True Range of a day’s trading is the difference between the day’s high and low, extended with yesterday’s close if it lies outside today’s range.
There is also a second set of rules for 2-candle scissor reversal.
Both the 1-candle and 2-candle reversal is plotted the same way, as lines of accumulation and distribution starting from the reversal candle.
Last feature of the script is it colors the bar if the price crosses and closes over support or resistance.
Does it work?
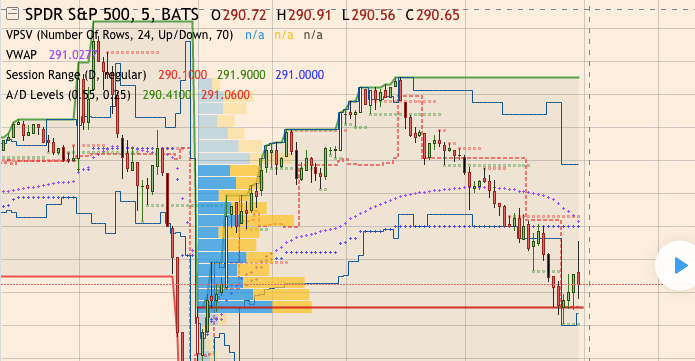
The author himself does not comment on the use of the script but the featured timeframe on the script page is 5M. He uses the A/D Levels together with volume profile, session range and volume-weighted average price.
You will see the changed candle color better if you remove candle border color in your chart settings on TradingView.
In my charts, yellow bars indicate break through support and white bars break through resistance.
Scalping: 5M Chart
Here is the A/D Levels script on Bitfinex BTCUSD 5M as retrieved on Sep 29.

I found that it printed ridiculous amounts of supports and resistances over ranges.
At the first sight it looks confusing but once you are able to look more at the bigger picture and less at the individual lines, it does say a lot about levels of resistance and support.
You can always make the required wick ratio higher though, so that the script does not detect every little wick. The default value is 0.55 (55% of TR).
Higher Timeframes

For the 30M timeframe and made the criteria for acceptable wick ratio even higher.
It did made sense to me, even considering the repeated breaks through the support lines that quickly bounce back.
It is important to note though that the script only remembers the latest reversal candle in the time series. Above you see that in the action between 6350 and 6500 where the resistance stops dead in the air because there was another passing reversal candle found later. You will need to use some judgement when evaluating the chart.
On the 1D chart, it is quite useful when you keep the default settings (0.55, 0.25).
It does not print support on volatile days’ wicks because it compares with the true range. You can also see where support turns resistance:

Summary
A single candle does not provide enough information to really judge the market. For scalping, evaluating a candle close might often be a little late. Other than that it is easy to print candles on the short timeframe.
I would recommend it as a source of helpful information about that’s going on at the market but I would not trade it as actual support/resistance lines.
For short-term positions, TensorCharts’ heatmap and trades counter is more precise than the A/D Levels, it does not make much sense to resort primarily to candle shapes.
Nonetheless, I am surprised the indicator actually provides quite a good information once you play with it for a few minutes.