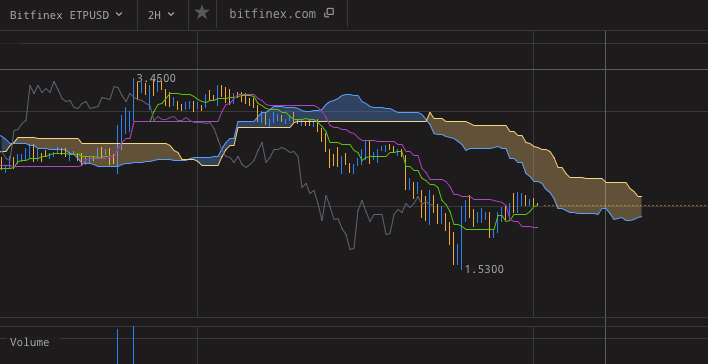
Key Points / TK Lines (TK Cross)
-
In technical analysis, TK Cross refers to a crossover of the Tenken and Kinjun lines (TK lines) of the Ichimoku Cloud indicator.
-
The TK lines are sometimes called the balance lines.
-
Tools for TK Lines (TK Cross): #tradingview #bitfinex
TK Cross Trading Strategies
The TK lines, or Tenken and Kinjun, are fast and slow moving averages.
As with any kind of moving averages, traders will look for their crossover to look for a potential trend reversal.
Another option is to read TK lines as an overbought/oversold indicator.
If the price action sticks around them, it signals that the asset is neither overbought nor oversold.
Conversely, if the price action travels very far from TK lines, it means the market is way out of balance.
In this situation a pullback is likely, but it is by itself not a trigger to open a position for the pullback - you should look to other indicators to confirm that. It is roughly comparable to the situation where the price overshoots outside of bbands.
In more stable markets or in sideways periods, price stays around these lines and traders watch how it is bouncing off them or crossing them when they are looking for a good entry.
Where to get Ichimoku Cloud
Ichimoku cloud is one of the default indicators available on TradingView, even with the free plan. You can find it in the public indicator library.
Read our list of tools for crypto traders for more free and freemium options.
An indepth look at TK Lines (TK Cross) is here.


