
This post on cryptocurrency technical analysis specifics was originally published in 2016.
Back then, it was a common debate in the TradingView chat whether technical analysis in crypto can actually work at all.
Does Technical Analysis Work in Crypto?
It was the time when the multi-year bull market in Bitcoin and most other cryptos was in its infancy, the markets were acting wild and every futures contract settlement day was filled with what Reddit dubbed the “Bart formation”: A steep rise in a single candle that doesn’t really catch on and is subsequently dumped in another single candle, or alternatively the opposite sequence known as the “inverse Bart”.
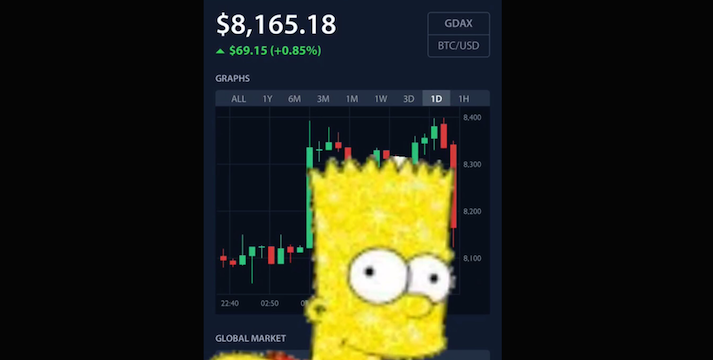
This used to be the daily bread of the BTCUSD market back in the day when it was a niche play, and it still can look this wild on small-cap altcoin markets.
In contrast to that, traders using some technical analysis tools and methods (along with healthy skepticism and well-trained judgement) have been more successful than not on the crypto markets.
The reason lies in the way technical analysis works in general.
So, how does technical analysis work at all?
Always loyal to my first trading principle:
— via Crypto Rand (@crypto_rand)
- Draw a lot of lines so it will look like you know what you are doing. pic.twitter.com/na9WaByn28
The problematic part lies in the way technical analysis works, not only in crypto but on any kind of market in general.
Technical trading in its core is about looking for chart patterns. Chart patterns are sequences of price action that are vaguely repetitive, which means that if you notice a pattern in the making, you have slightly better odds when speculating on what the price will do next.
Technical Trading as Relying on the Machine
One aspect of technical trading relies on what could be called the mechanical capabilities of the markets.
It is reasonable to assume some resistance to change in prices, when you are looking at the chart of something that is a currency or a company stock - really very much most often the value of any real thing will not change 100% overnight.
The technical analysis play for this principle can be translated into an indicator like bbands, which in very simple terms is a median price wrapped in its standard deviations. If the price action wanders out of the standard deviations boundary, it will most often be just about the time it starts wandering back inside - unless something nonstandard is happening. Looking at overbought and oversold areas at RSIs and similar oscillators is the same idea.
Technical Trading as Relying on History
Another aspect are historical levels that form support/resistance areas.
The idea behind this focus of technical analysis is not guessing that the price is likely to do the same thing at the price level that is being revisited, the roots of support and resistance are in the basic supply/demand logic.
If there is a price level that has been clearly perceived as “too expensive” since the history shows that used to be a lot of selling at one or more points in the past, then the demand will most likely weaken around that level again in the future, and that for so long until something outside of technical analysis changes.
In some cryptocurrencies like Bitcoin you could start talking about the halving here: If the supply of the asset decreases and at the same time the demand for it doesn’t decrease, at some point this will lead to rise in prices. On the charts, this will render as breaking up through a resistance zone.
The breaking up through resistance or breaking down through support can also be fully and completely a result of speculation, though. It is important to keep in mind that the price action on the charts is really just a result of the many forces acting on the market, not the gospel that defines the truth. Assets can be undervalued, assets can be overvalued.
And then there’s the one last thing to this: Support and resistance is such a popular technical analysis principle that it already takes us to the last aspect:
TA is a protocol for traders to implicitly coordinate their activities, using price history as the communications medium. u/dasignint on Reddit
Technical Trading as Relying on… Technical Trading
Especially with the rare and joyful events, like when a market is making new highs and so there is no history to account for, it’s time to shine for tools like Fibonacci, known most often as “fibs”. Fibs use obscure formulas which probably border on abuse of mathematics to project price levels where the future reversals are likely to occur.
How is that useful?
Short-term traders, and there are always many, like to flow with the market in both directions. This means that they do not want to risk missing a retracement, even if a short one.
This particular type of a trader would normally look at support and resistance levels to mark for themselves the price levels where the action is likely to reverse. When they do not have resistance levels available, because the market is trending above the all-time-highs, they will use fibs.
As long as there is no new information shaking up the market, the reversal will often actually happen around the fib level, because this is the easiest and most accessible tool for people to determine a price level where they will set their take-profit orders to scale out of their positions and manage their risk.
The profit-taking will slow down the trend and that in turn will catch the attention even of those traders who might not even know what “fibs” are.
Consequently, very often the fib will happen as a kind of self-fulfilling prophecy.
When Technical Analysis Doesn’t Work
If there is an unexpected important event happening, it will always shake up the markets, no matter how mature and stable they are: China bans Bitcoin? Of course. How about China banning the US Dollar, though? Of course there would be a shake-up too!
With some cryptocurrencies, the important event can be something far more prosaic, though.
Back in the day when BTC was popular enough to have semi-pro trading platforms but at the same time was still really a niche thing, the daily play was to leverage the fact that the market was small enough for people with maybe five digits USD to move it and literally buy their way.
Such a thing is still possible, there is also mostly no legal danger in doing so, because cryptocurrencies are unregulated markets.
The only thing that changed here is the amount of money and skill to paint the market the way you want it.
That is a fact and because of this technical analysis can always fail.
Resources: Bitcoin Technical Analysis
If you want to learn about technical analysis and other smart plays for lerge-cap cryptocurrencies, go through these posts:
- Market Timing using the combined data of “industry” leaders and aggregate data from indexes.
- Complex patterns like Fulcrum Bottom.
- The crowd psychology around market reversals.
- Complex ranging plays like when following Wyckoff.
Most Popular Cryptocurrency Trading Indicators
As a resource for your technical analysis, here is a list of the best cryptocurrency trading indicators that generally work for smaller-cap cryptocurrencies too, while you can still use them for Bitcoin as well.
- Fibonacci - as explained above, used to determine the most likely levels for price reversals, especially when it is not possible to draw support and resistance lines based on history because the price is making all-time-highs.
- For trending crypto markets, Ichimoku cloud is invaluable - this is an article with a ton of videos and resources
- Divergences - only used to establish a level where you should be looking for an entry, not precise enough to be a signal to enter.
- Volume flow - a free script for TradingView available from here.
- Scalping can be done on any kind of market, but it really needs a special kind of personality.
- Support and resistance - the magical lines on the charts, here as a deep dive written for the forex markets but applying just the same for cryptocurrency trading.
- Bollinger Bands - follow John Bollinger on Twitter.
- Moving averages - a classic is 50-200 crossover, more here.
- MACD - a classic on Reddit is a so-called squishy, bearish cross on 3D MACD.