
The crypto markets are going through a wave of relentless sell-offs that were propelled by the FED rate hike as well as forced selling as the Bitfinex whale fund 3AC and some other large players had to liquidate some of their losing positions.
The price action eventually took a relief bounce from the low of below 18000 USD for Bitcoin and cryptotwitter has launched several speculations as to who bought the dip.
Binance was the first rumored buyer, by now SBF (the co-founder of FTX exchange) leads the gossip stats.

Since the rumour has it the dip was bought by a single entity, or just a very small number of entities, it ended up adding to the fears that the pause from the market collapse will not last. If there is not enough other buyers to make the rally catch on, a single whale will not be able to carry the market on their shoulders.
So, just in case there’s something true to the that, here’s a list of tools that might well be useful again.
7 tools to watch when crypto markets tumble
Because a lot of the selling was forced and not speculative, technical analysis didn’t have much power there. One sign of that - and probably the one sign that everyone noticed - was that the market would bleed and bleed without bouncing. Impossible to chart anything unless you have good imagination.
Still, traders did end up following the charts. There’s not really much else you can do.
Here’s a list of 7 tools that crypto traders watched as the prices of everything tumbled. They are both technical and fundamental tools, and let’s start with the fundamental ones.
-
FED rate hike anticipation via CME
The first tool that crypto traders watched was the FED rate hike anticipation via the CME. This was because the FED rate hike would have a direct impact on the prices of cryptocurrencies - and of the prices of every asset that is perceived as risky.
All the basics are explained in this reference.
For the probabilities the market is pricing in, use the CME’s FedWatch tool.

-
Bitcoin dominance metrics
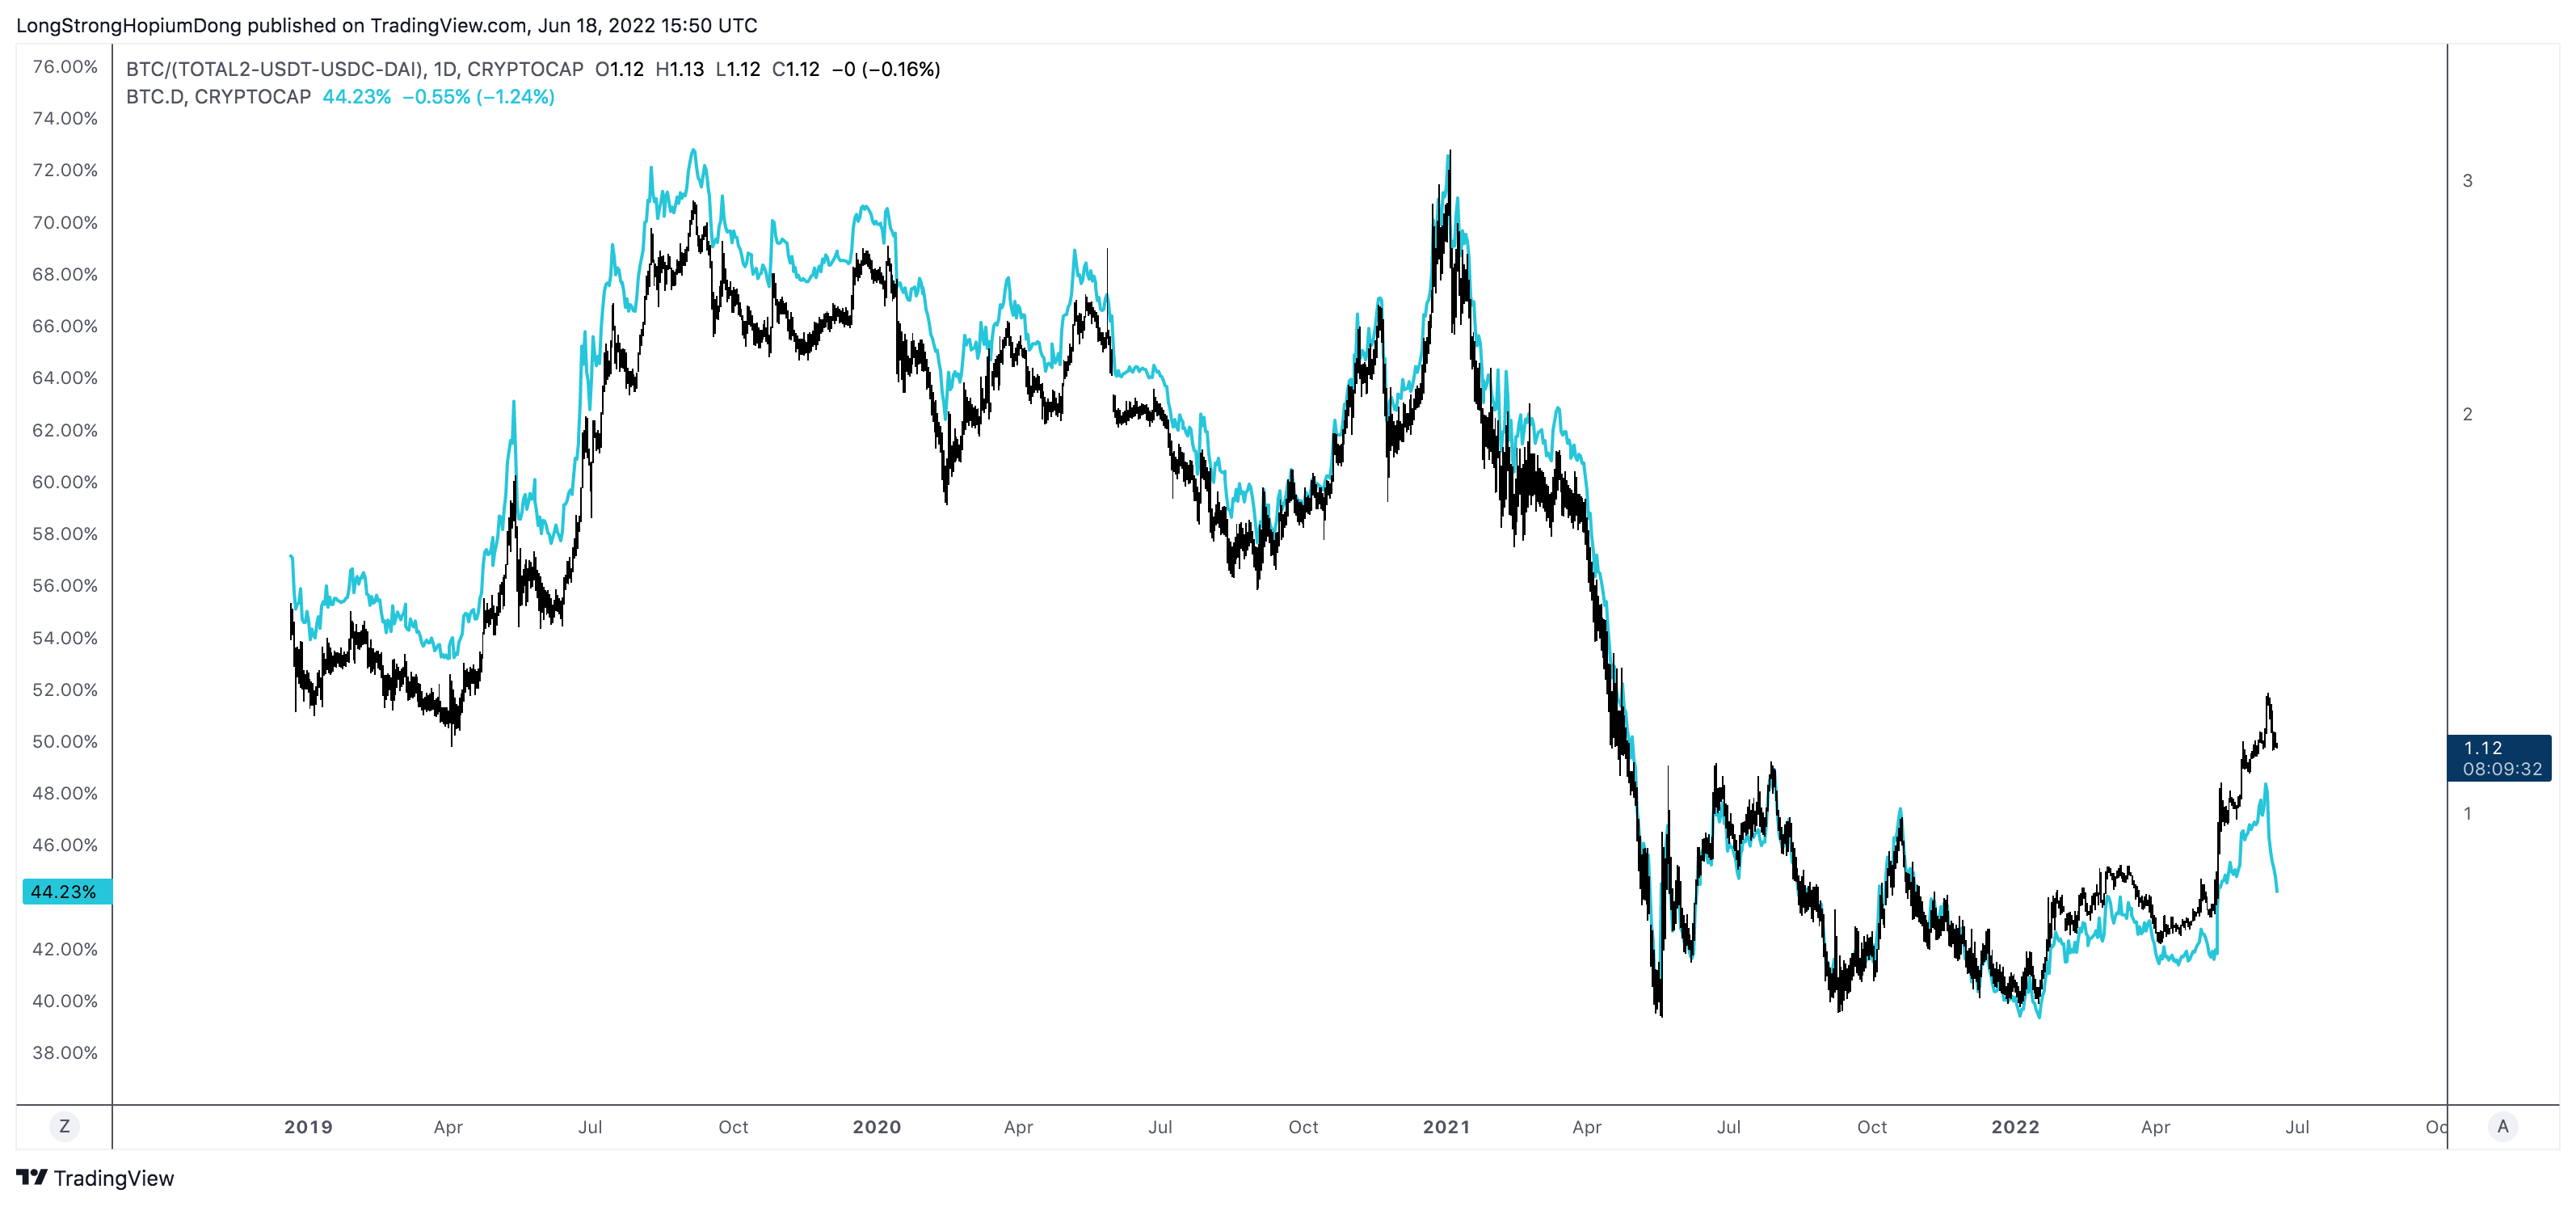
Bitcoin dominance, or BTC.D on Tradingview charts, is a technical tool that crypto traders watched as the prices of everything tumbled. This metric measures how much of the total market capitalization of cryptocurrencies is represented by Bitcoin.
The reason why this matters is that typically, as proven by history, all crypto markets will trend down together if the decline is serious. But if the markets start to turn, traders want to see Bitcoin rising while the rest of the market is lagging, it might be a sign that the market is about to turn around.
Even without speculating on where the bottom might be, BTC.D can provide a lot of information about the markets. Here’s BTC.D chart with or without stablecoins that was shared on the BitcoinMarkets forum:
Get a FREE Tradingview account
-
News about liquidations on DeFi blockchains
DeFi farms were a major feature of this past bull season. It was a completely new phenomenon, and it caught everyone’s attention.
The two technically strongest market leaders were Solana and Luna, consistently throughout the bull season. Those are the limitations of getting your intel from charts: Sometimes the price reflects a collective illusion, just like it happened before the mortgage crisis in TradFi.
When crypto started to crash, traders naturally looked at especially at lending platforms to see how they will do when everyone’s loans will start to get liquidated.
This kind of news would appear on Twitter and Medium accounts of those DeFi platforms first, but the huge subreddit r/Cryptocurrency would get the news soon enough.

-
Weekly SMA of 200 and 300
Long weekly standard moving averages were the last lines of support where some traders expected the price action to reverse.
Many bitcoin traders cited the Covid crash in early 2020 as an example - the market tumbled in the general panic but bounced on high volume back over the 200 SMA. Speculators were buying the dip at the 200 SMA in June 2022.

-
Weekly WMAs
The WMA is weighted moving average. A lagging indicator, but lagging less than standard moving average. Crypto traders use it to identify trends. The WMA of 200 and 300 were two technical tools that crypto traders watched as the prices of everything tumbled.
The WMA of 200 or 300 are used to identify long-term trends, which is why they are key tools in times when every asset enters the bear market territory.

-
Fibonacci lines
Fibonacci is the charting tool that will paint a line for you even in places where there’s just empty space. That is what makes the Fib the favourite technical analysis tool of crypto traders who want to chart possible pit-stop levels of crypto that is rallying past its all-time-high. In the same way, traders charted with Fibs to see where the markets might potentially get a bounce.
It did not work very well because a good chunk of the selling for forced and Fibs are based in technical analysis (and frankly, esoteric beliefs). On the other hand they do give a vague idea of levels on which traders on the sidelines might be willing to enter the market and they might work as a sort of coordinating tool.
-
The RSI family for momentum
The RSI is a momentum indicator that is more complex than ROC and therefore provides information about whether the market is “oversold”.
The RSI is a popular indicator in crypto trading communities especially now because it has been oversold for a long time. Traders jump to the conclusion that a reversal must be near.
Well, RSI doesn’t guarantee that the market cannot stay oversold. There’s actual money needed to bring the asset out of the oversold territory. If that money isn’t available, RSI might just keep being oversold.
Final words
Whether you trade on technical or fundamental analysis, it is important to understand that no market moves in a straight line. There are always corrections along the way. Do not let emotions get the best of you and enjoy the show!