
What are Tensorcharts?
The idea of TensorCharts is similar to the one behind Footprint Charts^(R).
The charts that will let you “see inside the bars” as their slogan says, and unlike many marketing catchphrases, this one actually fits.
- Learn about Footprint Trading in the ATNET Glossary
It’s an advanced charting tool particularly good for daytraders and scalpers on the legacy markets. You can request a free demo of the Footprint Charts app here.
Footprint candles
Difference between Tensorcharts vs Footprintcharts
With footprint chart you see the regular candlestick chart candle split into steps on the price axis (such as into steps by 100 USD). This way you get to see the exact amount of money traded on which price level.
Each footprint chart block is colored and has a number inside - the number of dollars that was traded in that block.
Tensor Charts, a web app developed originally for crypto, draw from a similar idea. With Tensor Chart you get different granularity of information, depending on much you zoom in.
That is actually a feature: It prevents the analysis paralysis.
The price blocks at Tensor Charts are always colored at a scale based on the volume traded there, zoom in and you’ll get the traded money as well.
Basically, it is similar to a far more precise volume flow script.
That’s not all though. In addition to the traded footprint, TensorCharts also provide a whole host of other advanced crypto trading tools.
Orderbook heatmap
What is Orderbook Heatmap
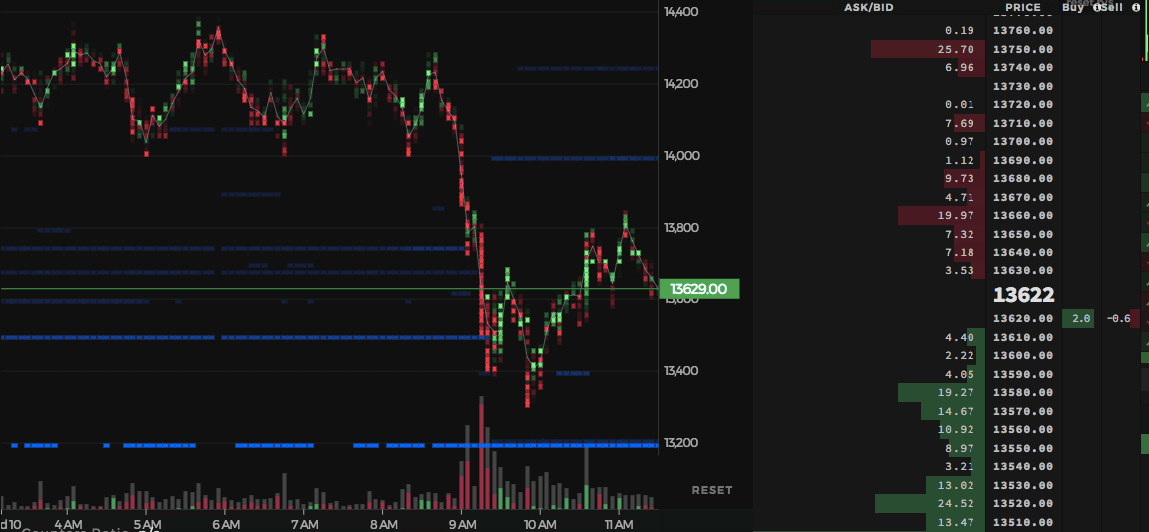
Here’s what I mean: Even in the basic free tier, TensorCharts provide the famous orderbook heatmap.
What’s the orderbook visualization good for? Let me explain:
- The price action, and therefore the market, is made by executed orders.
- Executed orders are displayed as green and red blocks for filled buys and sells. On a standard chart theese would be green and red candlesticks.
- The buy support and sell resistance is practically enforced by limit orders waiting on either side of the market. These are shown in shades of blue and yellow, distinguished by their size.

You can customize your orderbook heatmap through settings and decide how granular the data should be.
- To learn ow to use Tensor Charts head over to our TensorCharts Tutorials.
See the spoofers thanks to orderbook heatmap
The orderbook heatmap function makes it easy to discover buy and sell walls. You will also just as easily see if the walls get pulled or if they execute. If you have been crypto trading for a bit, you know that spoofers like to paint support and resistance only to cancel their orders just before they would get filled.
To see a spoofer on a candlestick chart you really need to stop staring at the chart, open up the full orderbook and meditate for a while.
Then, once the orders get pulled, there is no information left about them in the books.
Contrary to that, Tensor Charts record this event as the past orders remain recorded in the heatmap after the candle close.
Intermittent support and resistance for your 5-min trading strategies
Even when there are no spoofers though, the Tensor Charts’ heatmap also provides an idea about intermittent support and resistance levels.
You can clearly see the areas with most money in open orders at a single glance.
Here for instance significant buys on BCH markets:

Differences in strength between several altcoins
Last but not least, the differences between various cryptocurrency markets also become apparent fairly quickly.
This 5M tensor chart of the ETHUSD market shows a lot of small orders, some of them coinciding into a resistance level:

On this BTCUSD 5M chart you see the differences in order sizes are more marked, there are a few key levels with huge orders but the rest of the orders filling the space in between is of quite insignificant size in comparison:

There’s lot more that you can do with TensorCharts, I encourage you to explore their documentation.
TensorCharts FREE Plan
TensorCharts are available free with basic functions pulling data from the most popular exchange APIs: Bitfinex, Binance, GDAX, BitStamp, BitMEX. In the free plan you get 5M and 1H timeframes, orderbook heatmap and trades counter.
It is not necessary to create a user account.
If you like working with orderbook heatmaps and only basic indicators like bbands or fibs, Tensorcharts are far better than the currently most popular free charting app Cryptowatch.
TensorCharts PRO Plans
Paid plans went live on September 18th 2018, one year to day since the development of the TensorCharts app started.
Plans range from 8 USD - 25 USD per month, paid only in crypto.
- To learn ow to use Tensor Charts head over to our section for TensorCharts Tutorials.
Tensorcharts Free Alternative
If you are not sure you are willing to pay for this stuff, you can piece together a poor man’s tensorcharts alternative on TradingView.
It is not even close to the same product, but if you just don’t want to pay, it is something.
- Make a chart at TradingView FREE
- Go to Indicators and script and search for “Poor man’s volume profile”, a free VPVR alternative. Apply it.
- Next look up “[ST] Volume Flow v6” by spacetrader, which colors your candles based on changes in volume. It colours full candles as a whole, the data is less granular than footprint candles. But it’s free.
Summary: Powerful Tool
TensorCharts have come a long way since we first published a post about them in January 2018.
As the development advanced, programmable indicators were added along with experimental indicators such as the Counters Ratio.
TensorCharts are now beating both Cryptowatch and TradingView in terms of the amount of information (and therefore edge) you can extract from them.
We were probably the first blog to call for paid plans, this kind of tool should not be available for free.
We’re happy the paid plans are here, it could help with the only issue Tensor Charts traders keep complaining about: That during abrupt price action you can only hope the server won’t get too overloaded. I’d argue it’s still not as bad as when you get this on BitMEX though.
Still, even the free version of Tensor Charts can give you quite a good edge if you use it right.
- Tensorcharts on Twitter: @tensorcharts
- Tensorcharts on Youtube
- Post about Tensorcharts on ProductHunt
Full TensorCharts Pricing information
| FREE | PREMIUM | TEAM | ALGO TRADER | |
|---|---|---|---|---|
| $0 | $18 | 5x$8 total $40 | $25 | |
| For newcomers exploring orderflow, heatmaps and volumetric analysis | For experienced daytraders who don’t want to compromise on anything. Low latency, full data and all features available | For a team of 5 members, great value/price ratio. Full feature set, quality data and good update rate | Do you need just TC data, low latency and unlimited websocket subscriptions? | |
| CONNECTIVITY | ||||
| # of devices | 1 | 1 | 5 | 1 |
| # of simultaneous markets | 3 | 20 | 5*10 | unlimited |
| # of server side alerts | 1 | 50 | 5*25 | 0 |
| DATA | ||||
| trades history | 10min | 3h | 1h | 3h |
| large trades history | X | 3d | 24h | 3d |
| double data history | X | ✔ | ✔ | ✔ |
| orderbook price range | 10% | 15% | 10% | 15% |
| update rate | 10s chart, 1s trades | 0.8s chart, 0.1s trades | 0.8s chart, 0.7s trades | 0.8s chart, 0.1s trades |
| FEATURES | ||||
| timeframes | only 1h, 5min | all | all | all |
| # of trades counters | 1 | unlimited | unlimited | 1 |
| scripts | only defaults | defaults+custom | defaults+custom | only defaults |
| ads | yes | no ads | no ads | no ads |
| customer support | low priority | highest priority | high priority | highest priority |
| drawings saved in cloud | ✔ | ✔ | ✔ | ✔ |
| tick chart | X | ✔ | ✔ | X |
| early access to new features | X | ✔ | ✔ | X |
| CVD | X | ✔ | ✔ | X |
| large trades tracker | X | ✔ | ✔ | X |
| scripting module | X | ✔ | ✔ | X |
| trades feed sound | X | ✔ | ✔ | X |
| unlimited trades counters | X | ✔ | ✔ | X |
| volume profile / fixed / delta | X | ✔ | ✔ | X |
| vwap | X | ✔ | ✔ | X |
| real time chart | X | ✔ | ✔ | X |
| bitmex stats | X | ✔ | ✔ | X |
| heiking ashi + renko | X | ✔ | ✔ | X |
| numerical heatmaps | X | ✔ | ✔ | X |
| data export | X | X | X | ✔ |
TensorCharts Pricing Info
The cost of TensorCharts subscription is comparable with TradingView. It really only comes down to which platform you prefer for your trading.
For BlackFriday, TensorCharts usually dicount their Premium plan by full 50%.
More about typical crypto charting Black Friday offers
50% OFF Tensorcharts Premium:
- 9 USD per month (standard price is 18 USD)
- payments in BTC
| FREE | PREMIUM | TEAM | ALGO TRADER | |
|---|---|---|---|---|
| $0 | $18 | 5x$8 total $40 | $25 | |
| For newcomers exploring orderflow, heatmaps and volumetric analysis | For experienced daytraders who don’t want to compromise on anything. Low latency, full data and all features available | For a team of 5 members, great value/price ratio. Full feature set, quality data and good update rate | Do you need just TC data, low latency and unlimited websocket subscriptions? |
Start with TensorCharts For Free and if you like it, upgrade the next Black Friday.
========